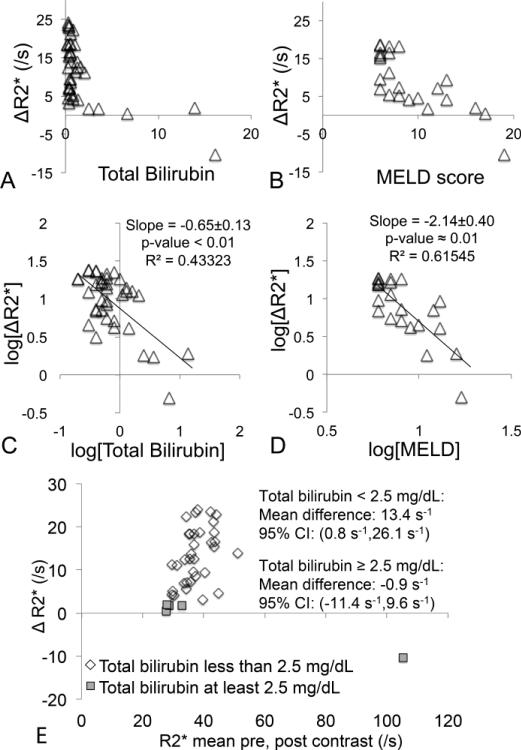
Figure 7.
Comparison between imaging and blood analysis measurements, including scatterplots of (a) ΔR2* vs total bilirubin, and (b) ΔR2* vs MELD score. Also shown are logarithm-domain linear regressions for the same comparisons (excluding the one value ΔR2*<0): (c) ΔR2* vs total bilirubin, and (d) ΔR2* vs MELD score. Finally, (e) shows Bland-Altman analysis for ΔR2* performed separately for groups of patients with total bilirubin <2.5 mg/dL (33 patients) and ≥2.5 mg/dL (5 patients), respectively. In the first group there is a significant increase in R2* post-contrast, whereas in the second group there is no increase in R2*. Only high flip angle R2* was analyzed here for brevity.

