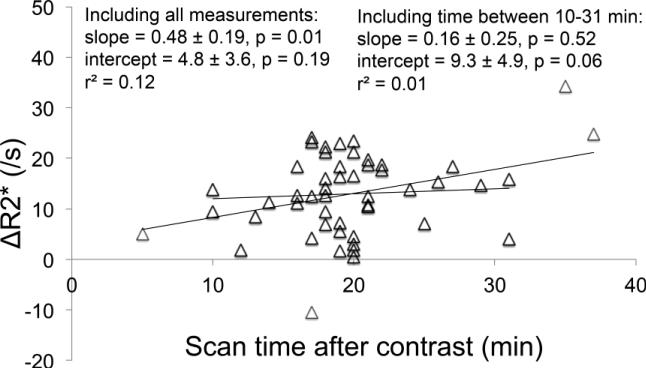
Figure 8.
Comparison between the delay time after contrast (in minutes) and ΔR2* (in s−1). Including very short (<10 min) and very long (>34 min) times results in a significant increase in ΔR2* with time after contrast (p=0.01), but excluding these extreme values results no significant correlation between ΔR2* and time after contrast (p=0.52).

