
Figure 1.
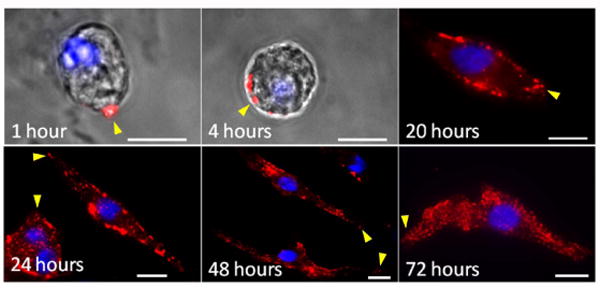
Fluorescent images of BM-laminin structure at 1, 4, 20, 24, 48, and 72 h. Laminin in red, DAPI in blue. Arrowheads point to the polarized end of neonatal CMs. Scale bars: 10 μm.
Official websites use .gov
A
.gov website belongs to an official
government organization in the United States.
Secure .gov websites use HTTPS
A lock (
) or https:// means you've safely
connected to the .gov website. Share sensitive
information only on official, secure websites.
Fluorescent images of BM-laminin structure at 1, 4, 20, 24, 48, and 72 h. Laminin in red, DAPI in blue. Arrowheads point to the polarized end of neonatal CMs. Scale bars: 10 μm.