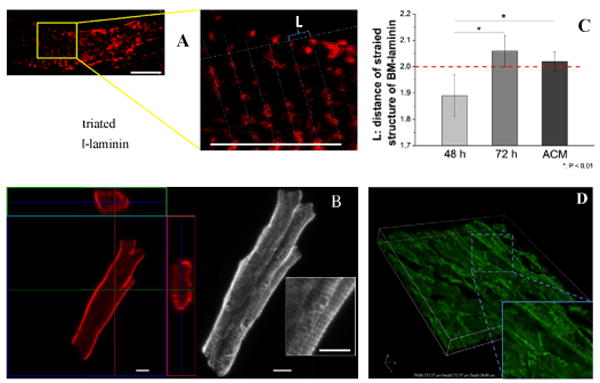
Figure 3.

(A) Striated structure of BM-laminin on a neonatal CM in culture on aligned collagen at 48 h. L indicates the distance between two adjacent striations, scale bar: 10 μm; (B) Orthogonal view of BM-laminin structure of a freshly isolated adult CM (ACM, left), z-plot image from 15 layers of Z-stack (right), enlarged striated structure (rectangular box), scale bar: 10 μm; (C) Average L values of neonatal CM cultured at 48 and 72 h and of an ACM; dashed red line represents the L value of a typical adult cardiac-muscle fiber, *: P < 0.01, scale bar: 10 μm; (D) 3D side view of laminin-stained adult cardiac-muscle-tissue section at a thickness of 30 μm with enlarged image at right bottom corner.
