Figure 1.
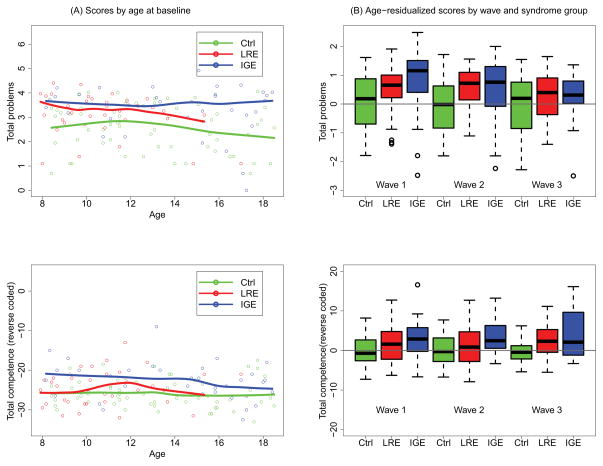
Total Problems and Total Competence (reverse coded) by age, wave, and diagnostic group. (a) Scatterplot of scores by age at baseline, with accompanying flexible curve fitted to data, for each of two epilepsy syndrome groups (LRE and IGE) and healthy control participants. (b) Boxplots of age-residualized scores by syndrome group (LRE and IGE versus healthy control) and wave. Comparison participants were used as a reference to compute residuals as explained in the text. The p values for fully adjusted comparisons are given in Table II. Boxplots follow standard statistical practice. Briefly, the top, bottom, and middle of the box represent the third and first quartiles and the median, respectively. The bar at the top of the upper whisker is the largest data point that is within 1.5 times the interquartile range (IQR) from the third quartile, where the IQR is the difference between the third and first quartiles. A symmetric description applies to the bar at the bottom of the lower whisker. The data points outside the whiskers are greater than 1.5 times the IQR from the third or first quartiles, may be considered outliers, and hence are worthy of their own display. Comp., healthy comparison group; IGE, idiopathic generalized epilepsy; LRE, localization-related epilepsy.

