
Fig. 2. Association between metabolic factors and structural volumes.
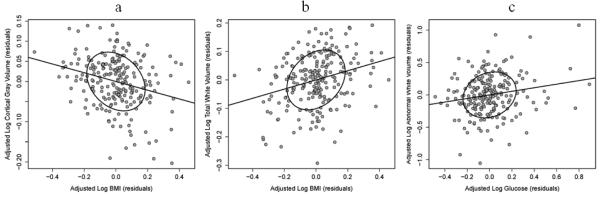
Partial correlation scatterplots (plots of partial residuals) show the relationship between metabolic variables and log-transformed volumes, after adjusting for all other control variables in the single metabolic variable regression models. a) BMI and cortical gray matter; b) BMI and total white matter; and c) glucose levels and abnormal white matter.