Figure 1.
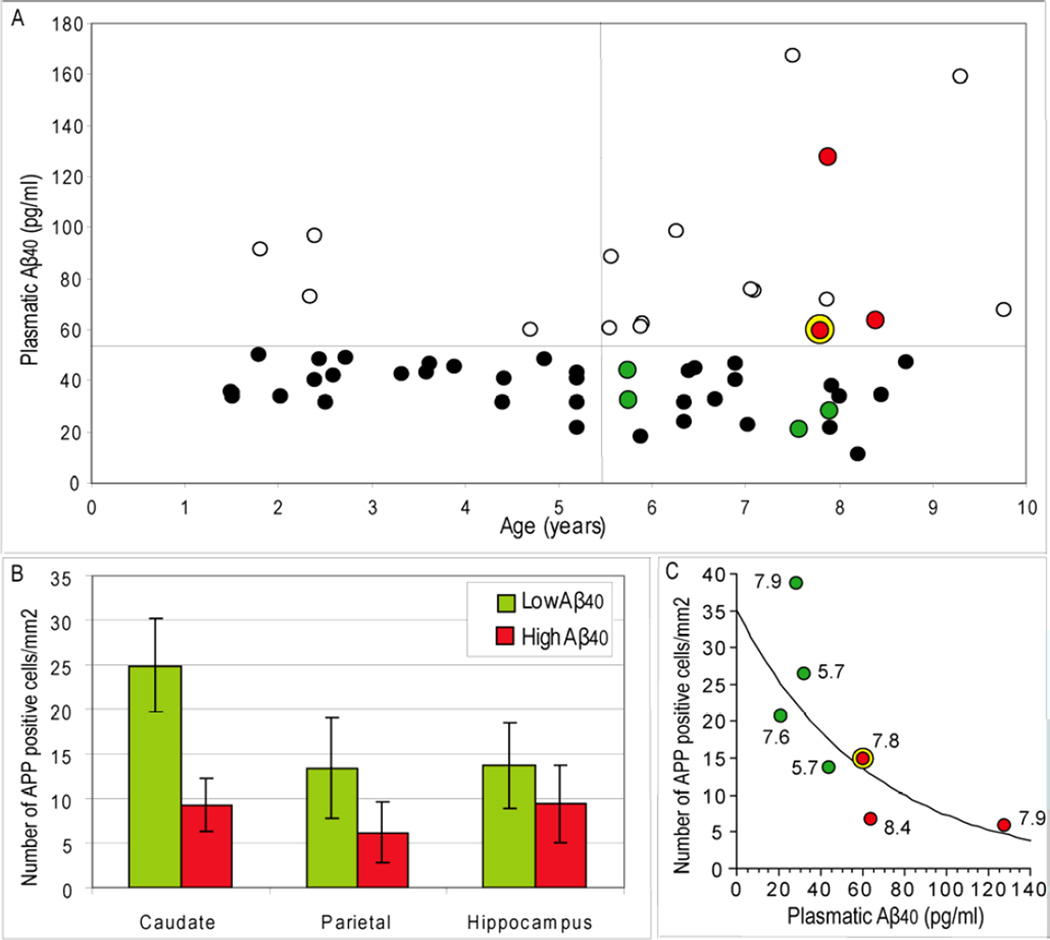
A. Plasma Aβ40 in mouse lemurs primates (n=25 young animals (1–5.5 years) and n=33 aged animals (5.5–10 years)). Aβ levels were classified either as low (≤55 pg/ml; dark or green spots) or high levels (>55 pg/ml; white or red spots). A larger number of animals older than 5.5 years had a high Aβ level as compared to young animals. The green and red spots correspond to animals that were studies by histology. The yellow ring corresponds to an animal that had extracellular amyloid deposits. B. Number of neurons presenting intracellular Aβ positive profiles in the caudate, parietal cortex and hippocampus of animals with low and high plasmatic Aβ loads (data represent mean±SEM). C. Plot fitting plasmatic Aβ and the density of intracellular Aβ aggregates in the caudate of aged animals. The values on the side of the dots are ages of the animals at blood sampling. The curve represents a logarithmic fit between intracellular Aβ and plasmatic Aβ. A significant negative correlation was found between intracellular Aβ and plasmatic Aβ (r=−0.86, p<0.05).

