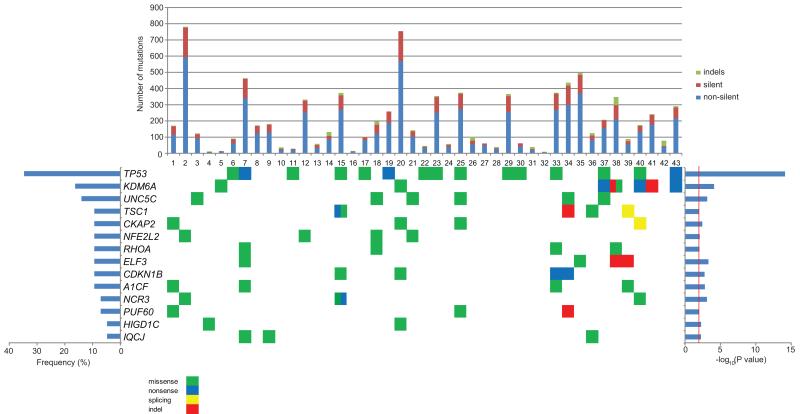
Figure 1.
The significantly mutated genes derived from both Genome MuSic and MutSigCV algorithms were represented in this figure. In the top panel, a graphical representation of the number and type of somatic mutations observed in the significantly mutated genes of each sample was presented. The frequencies (% of analyzed samples) of mutations in each gene are depicted in the bar graph on the left and −log10(p-value) is shown on the right panel.

