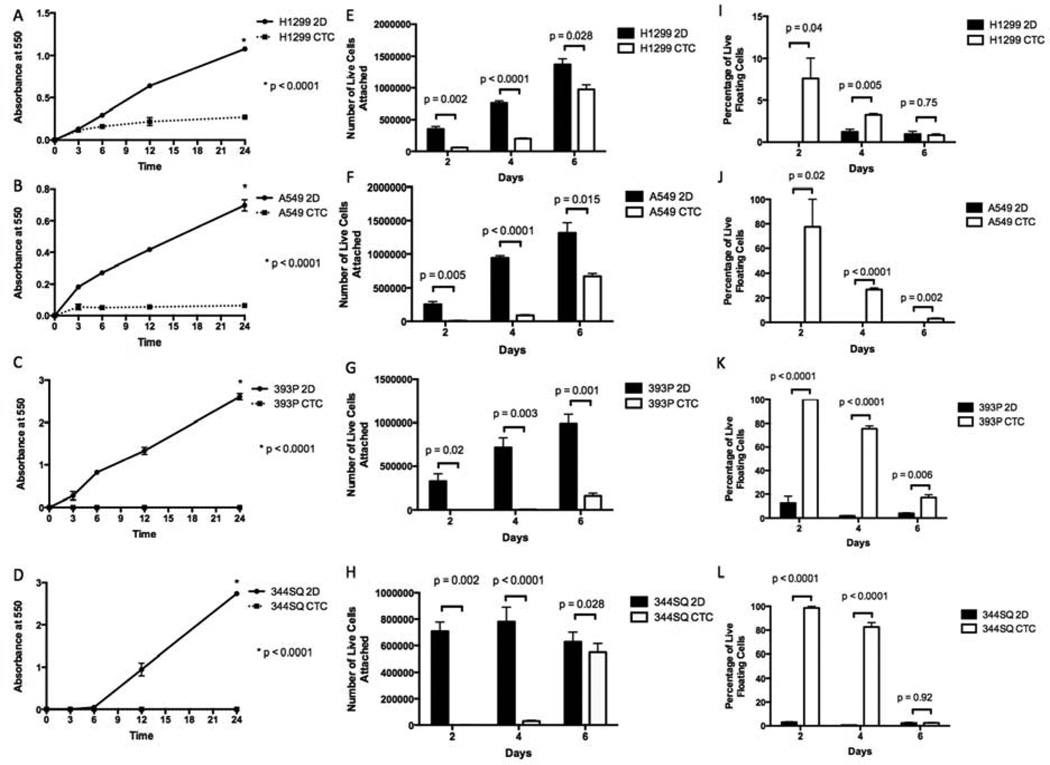
Figure 2. Comparison of in vitro characteristics of 2D versus CTCs.
(A–D) CTCs from the 4D model seeded with H1299 (A), A549 (B), 393P (C), and 344SQ (D) cells were significantly less adherent than respective cell lines cultured on a petri dish (2D). (E–H) CTCs from the 4D model (CTC) seeded with H1299 (E), A549 (F), 393P (G), and 344SQ (H) cells had significantly fewer cells that were attached to the petri dish on days 2 and 4 compared to the same cells grown on a petri dish (2D). (I–L) Total number of the live cells that were floating in the supernatant in the CTCs from the 4D model seeded with H1299 (I), A549 (J), 393P (K), and 344SQ (L) cells on days 2 and 4 were significantly higher compared to the cells grown on a petri dish (2D). The error bar represents the standard error of mean.

