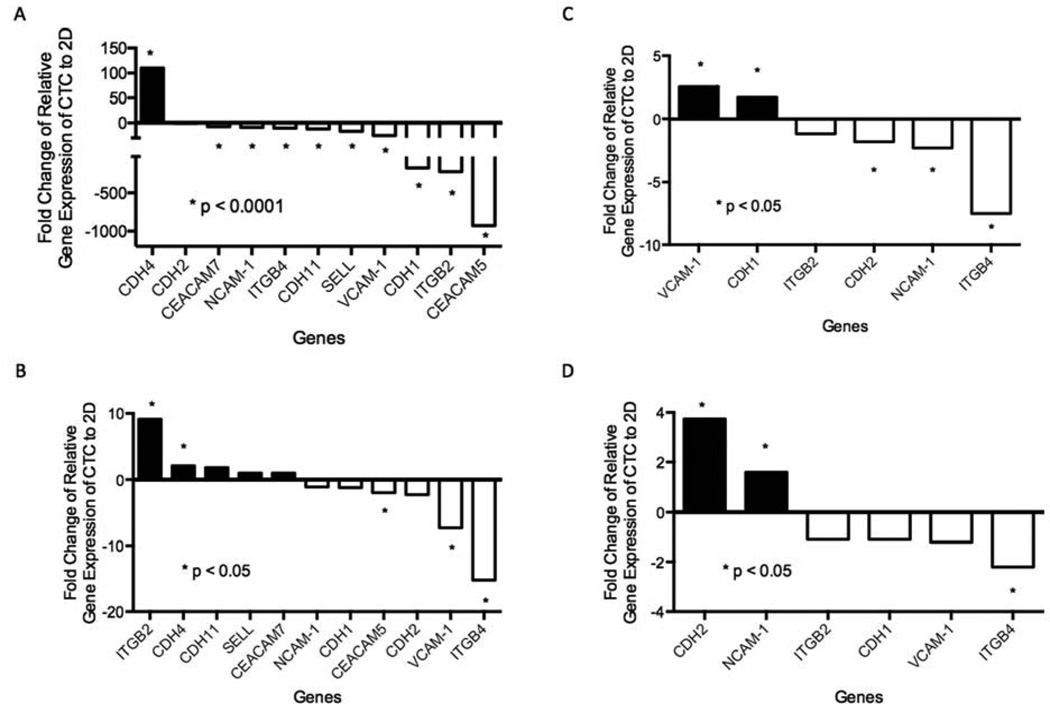
Figure 3. RT-PCR of cell adhesion molecules.
(A–D) Relative gene expression of cell adhesion genes in CTCs from the 4D model seeded with A549 (A), H1299 (B), 393P (C), or 344SQ (D) cells compared to the respective 2D cells. RT-PCR shows that only ITGB4 was significantly downregulated in CTCs compared to the 2D model in all four cell lines.

