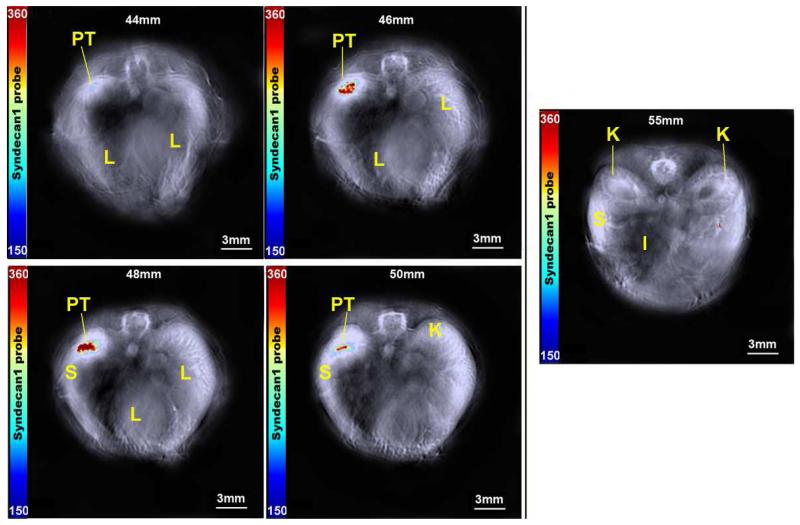
Figure 4.
Serial axial slices demonstrating probe accumulation within the tumor at 2 mm intervals. Tumor (PT) can be seen from 44-50mm. Reference organ locations of spleen (S), liver (L), kidney (K), and intestine (I) are indicated. Minimal signal was seen outside of the tumor bed, and no signal was evident within the kidneys at 55mm. The right lobe of the liver is prominent on images 46-50mm, with no accumulation of probe. The color bar represents syndecan-1 probe from 150-360 MSOT a.u.

