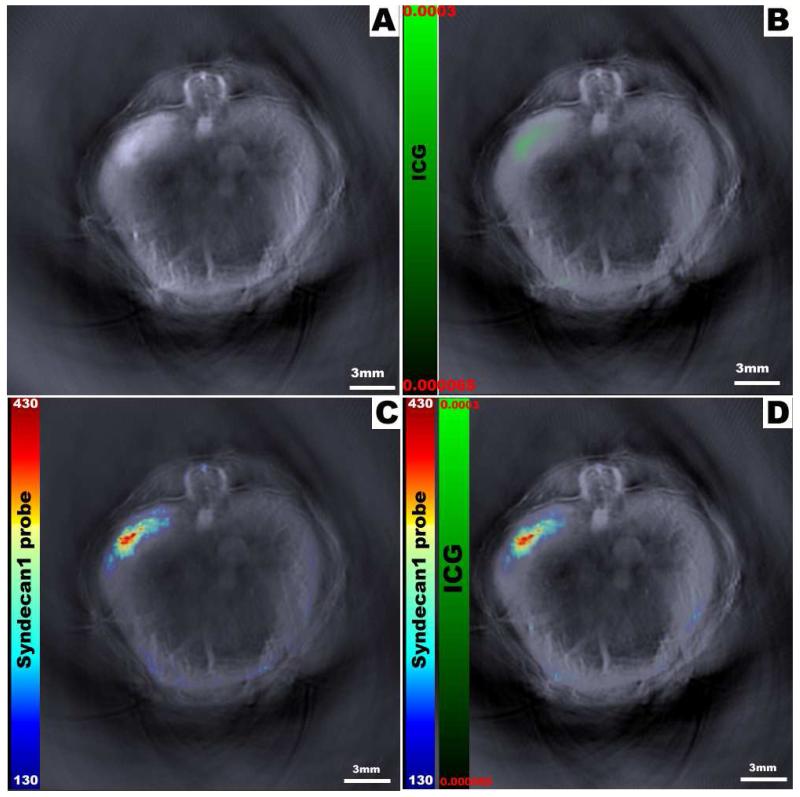
Figure 5.
Multispectral processing allows simultaneous comparison of distinct probes within the mouse. Here we seen the reconstructed optoacoustic image without exogenous contrast (A); image with free control dye (ICG) only (B); image with syndecan-1 probe only (C); and both syndecan-1 probe and ICG overlaid onto the original image (D). While the green color bar represents ICG dye from 0.000065-0.0003 MSOT a.u., the rainbow color bar represents syndecan-1 probe from 130-430 MSOT a.u.

