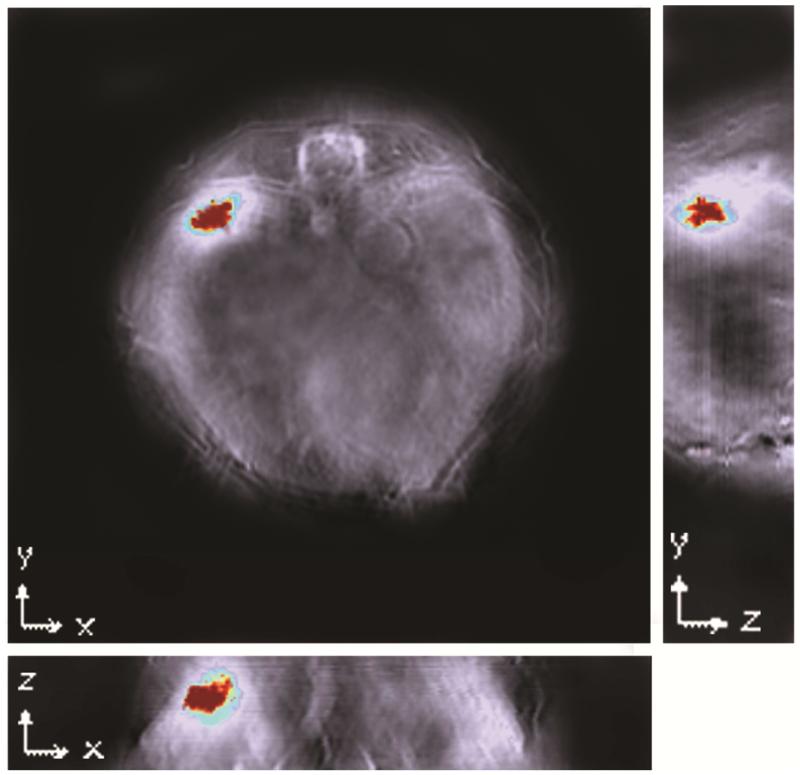
Figure 7.
Orthogonal views of the tumor demonstrate signal distribution throughout the tumor along all three coordinates, indicating good distribution of probe into the tumor bed. Reconstruction was conducted using backprojection at a resolution of 75μm. Signal was homogenised using 3-dimensional Gaussian filter (size 9×9×3) in MATLAB. The Multispectral Processing was conducted using Linear Regression [MATLAB]. Orthogonal view was created using Image J software.

