Figure 2.
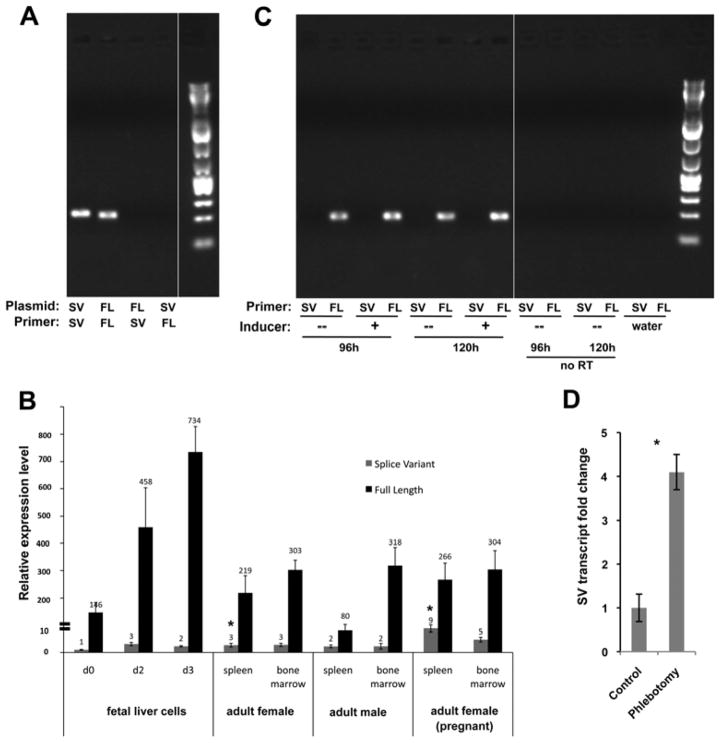
Quantitative analysis of splice variant levels. (A) Specificity of full-length (FL) or splice variant (SV) primer pairs was tested with plasmid DNA encoding the indicated isotype. (B) Quantitative analysis of FL (black) and SV (grey) levels in RNA derived from the indicated primary tissues is shown. Fetal liver cells underwent an erythroblast expansion phase (d0) followed by a terminal differentiation phase (d2, d3) [15]. All levels are normalized to the SV level seen in d0 fetal liver cells (=“1”). Note the discontinuity in the Y-axis as indicated. *p<10E-4 (based upon comparison of SV levels in spleens from pregnant compared to non-pregnant females). (C) RNA from MEL cells that had been induced for 96 or 120 hours with DMSO was analyzed for FL and SV expression by endpoint PCR along with uninduced and negative controls. (D) SV levels in spleens from phlebotomized or untreated adult females were determined and compared; SV level of untreated was given a value of “1”. Biological triplicates were each analyzed in triplicate. *p<0.002.

