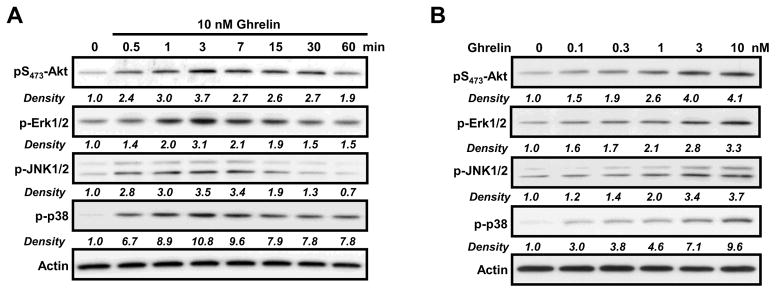
Figure 3. Kinetic and dose response analysis of the effects of ghrelin on Akt and ERK1/2 phosphorylation in D0.11.10 cells.

D0.11.10 GHS-R1a-transfected T cells (2 × 10⁶) were incubated for the indicated time periods with ghrelin at 10 nM (A) or with increasing concentrations of ghrelin for 7 min (B), after which the cells were lysed and extracted proteins were examined by immunoblot analysis using antibodies specific for phosphorylated residues of Akt, ERK1/2, JNK1/2 and P38. Experiments were repeated 4–5 times and representative blots are shown. The density of each band was measured by Multi Gauge V3.1 software (Fujifilm, Tokyo, Japan) and normalized to the intensity of the β-actin band for the same sample.
