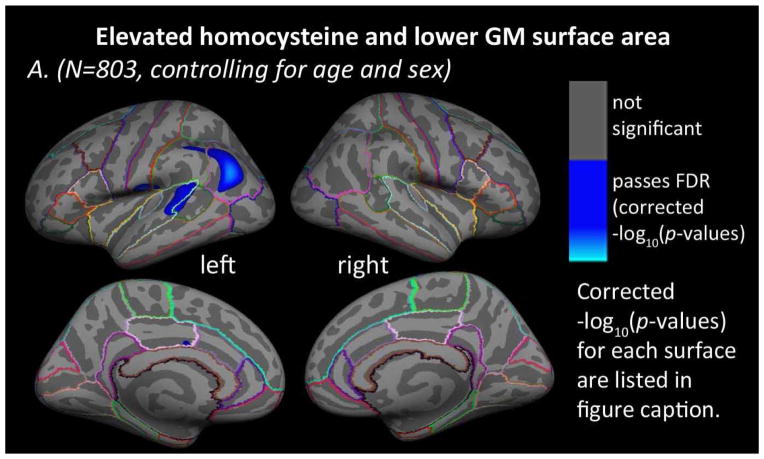
Figure 3. Homocysteine and cortical GM surface area.
Whole brain 3D maps of significant associations between homocysteine levels and cortical gray matter (GM) surface area in the left and right hemispheres of all N=803 subjects, (A) after controlling for age and sex (left: −log10(p-value)=2.763–5.021, right: not significant, FDR corrected) and (B) after controlling for age, sex, and diagnosis (AD, MCI, or healthy elderly) (left and right: not significant, FDR corrected). Results were corrected for multiple comparisons by thresholding at a p=0.05 false discovery rate (FDR) threshold across the entire brain surface. Blue areas represent points on the cortical surface where t-values passed the corrected significance threshold for a negative relationship between homocysteine levels and cortical GM surface area (higher levels of homocysteine associated with lower cortical GM surface area). No areas of significant positive associations were found.

