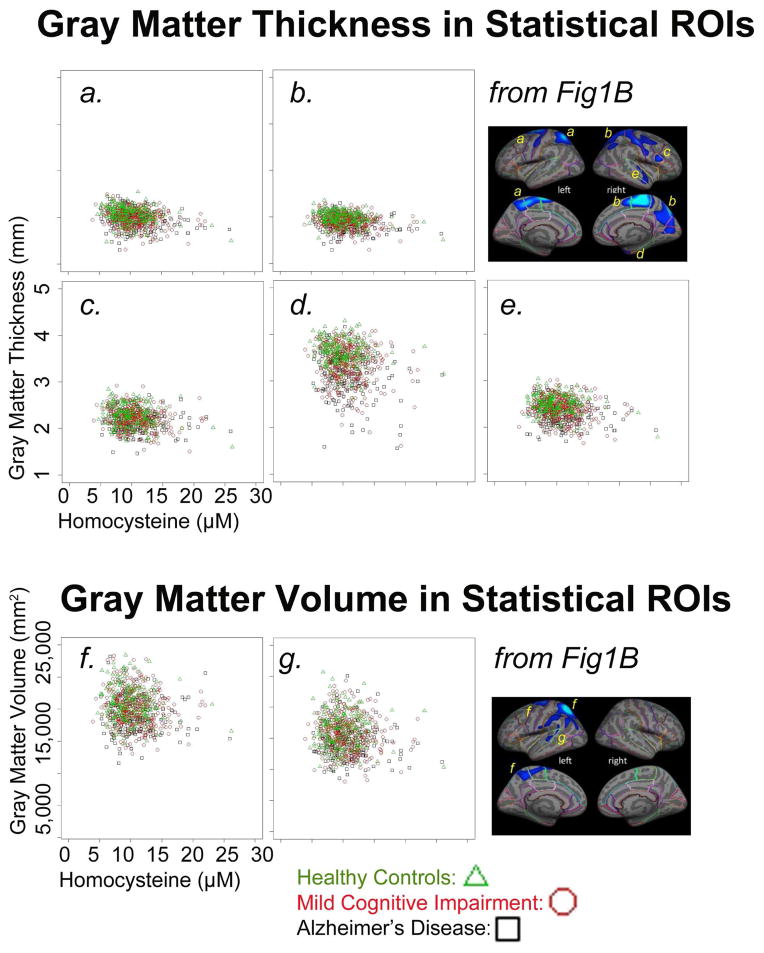
Figure 4. Homocysteine levels and GM measures plotted for each subject.
Scatter plots show homocysteine levels and mean cortical gray matter (GM) thickness (A, mm) or total cortical GM volume (B, mm2) for all N=803 subjects in statistical regions of interest. Data is shown for regions with a significant association between homocysteine levels (μM) and cortical GM measures in the whole brain, after controlling for age, sex, and dementia, FDR corrected (panel B in Figures 1 and 2). Healthy control subjects are shown with green triangles, subjects with mild cognitive impairment are shown with red circles, and subjects with Alzheimer’s disease are shown with black squares.

