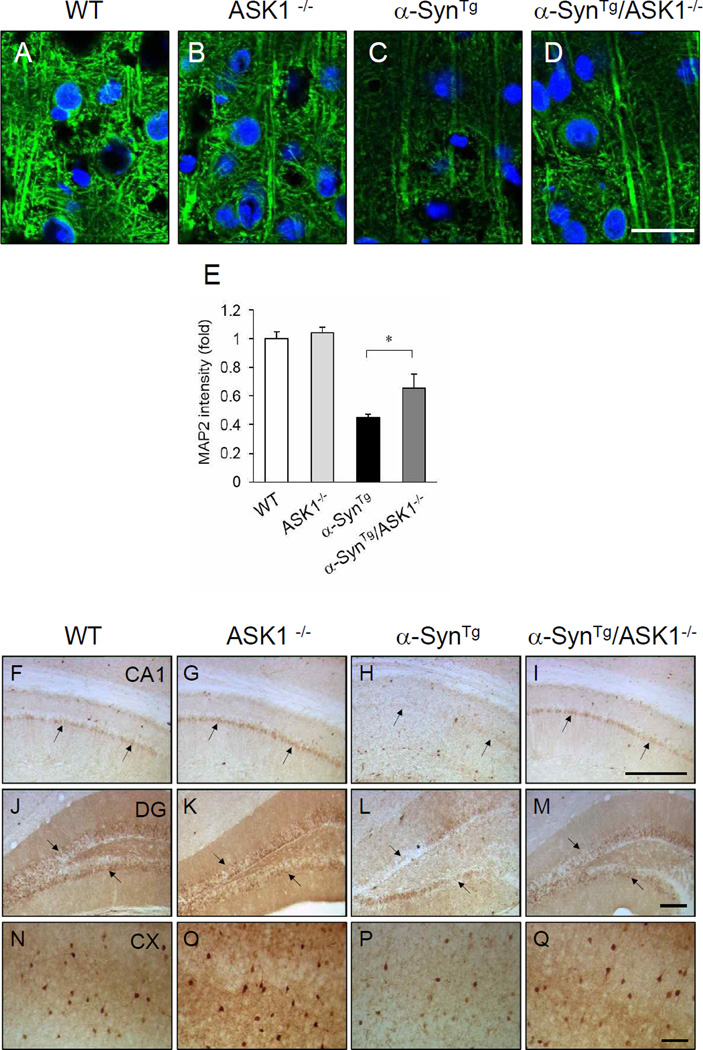
Figure 3.
Improvement of dendritic arborization and restoration of calbindin immunoreactive neurons in α-SynTg /ASK1−/− mice compared to α-SynTg mice. (A–D) Immunofluorescence staining of MAP2 (green) in the cortex. Nuclei are stained blue with DAPI. Scale bar = 100 µm. (E) Quantification of MAP2 intensity (n: wild-type mice = 3; ASK1−/− = 3; α-SynTg = 4; α-SynTg /ASK1−/− = 3). *P<0.05. (F–Q) Immunohistochemistry for calbindin in CA1 (F–I) and dentate gyrus (J–M) of the hippocampus, and in cortex (N–Q). Scale bar = 200 µm.

