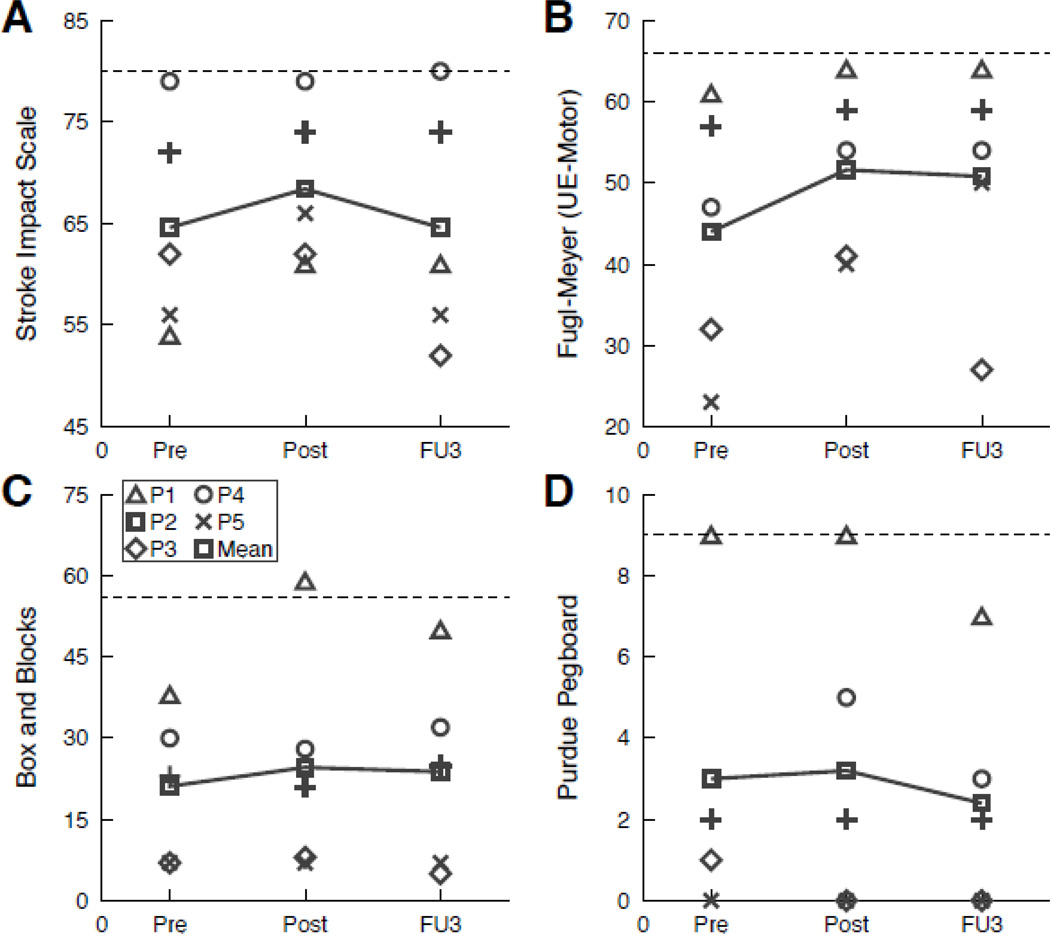
Figure 3.
Individual and group outcomes on clinical measures. Results presented for Stroke Impact Scale (A), Fugl-Meyer Assessment of Sensorimotor Impairment UE section (B), Box and Blocks Test (C), and Purdue Pegboard Test (D). Dashed lines in A and B show maximum attainable score (normal). Dashed lines in C and D show the lower limit of normal range. For all measures, increases in score indicate improvement. Abbreviations: UE, upper extremity; Pre, Pre-test; Post, Post-test; FU 3, Follow-up 3.

