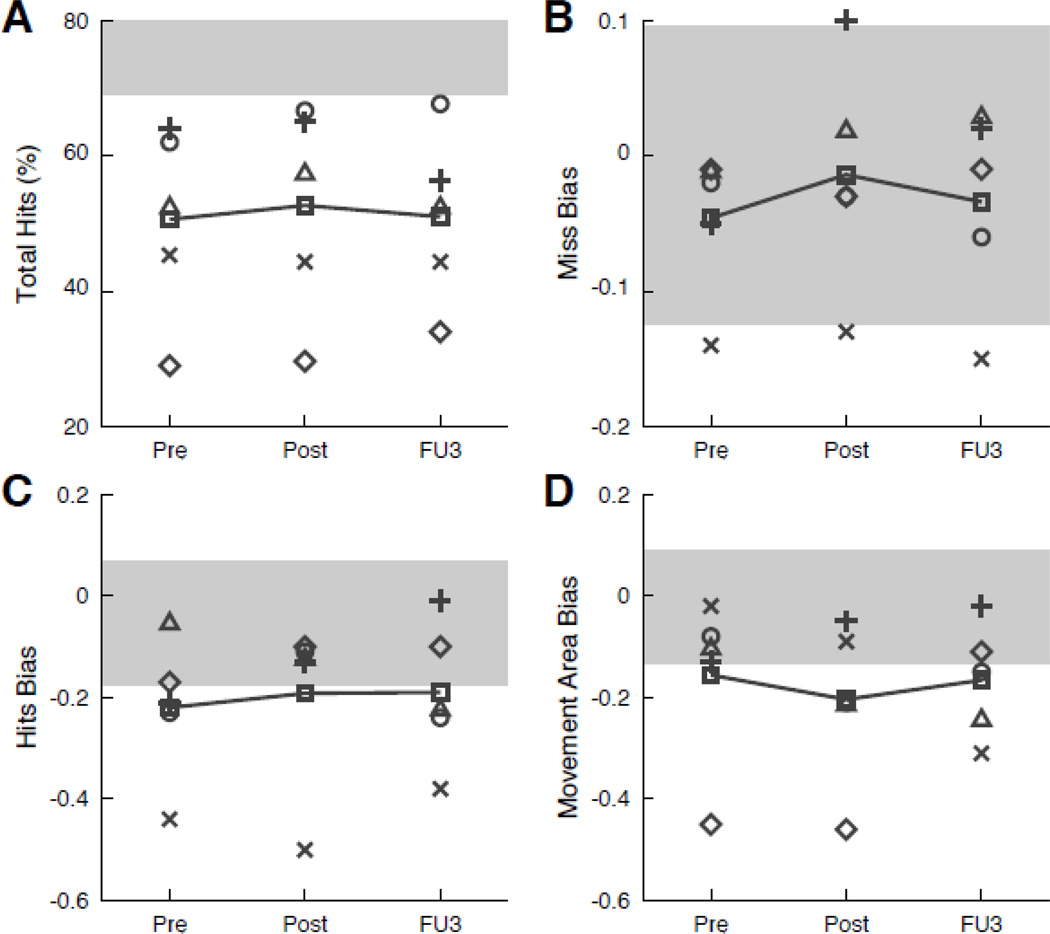
Figure 5.
Individual and group outcomes on object hit task. Results presented for total hits (A), miss bias (B), hit bias (C), and movement area bias (D). For all measures, movement towards normal range (grey shaded areas) is indicative of improvement. Abbreviations and symbols same as Figure 2.

