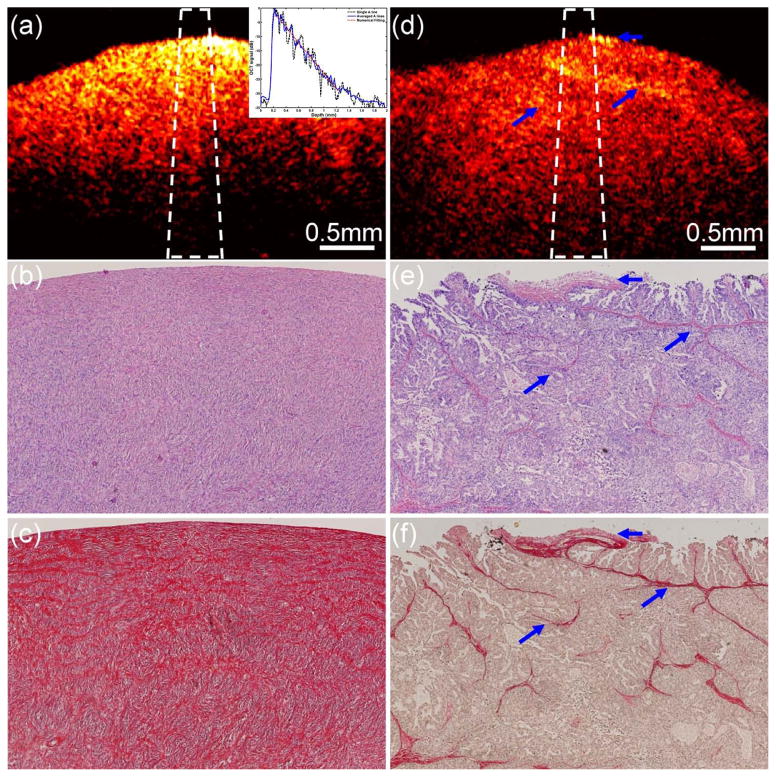
Figure 4.
One set of examples from normal (a–c) and malignant (d–f) ovarian tissue. (a), (d): OCT images; (b), (e): H&E histology; (c), (f): picrosirius red stains. Inset: fitting example; blue arrows: collagen bundles. (Reprinted with permission from Ref 47. Yang Y, Wang T, Biswal NC, Wang X, Sanders M, Brewer M, Zhu Q. Optical scattering coefficient estimated by optical coherence tomography correlates with collagen content in ovarian tissue. J Biomed Opt 2011, 16:090504.)

