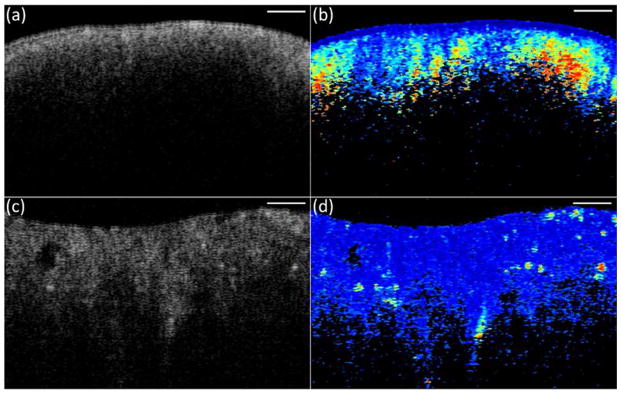
Figure 6.

Intensity OCT (a, c) and phase retardation images (b, d) from normal (a, b) and malignant (c, d) ovarian tissue. Scale bar, 0.5 mm. (Reprinted with permission from Ref 73. Yang Y, Wang T, Wang X, Sanders M, Brewer M, Zhu Q. Quantitative analysis of estimated scattering coefficient and phase retardation for ovarian tissue characterization. Biomed Opt Express 2012, 3:1548–1556.)
