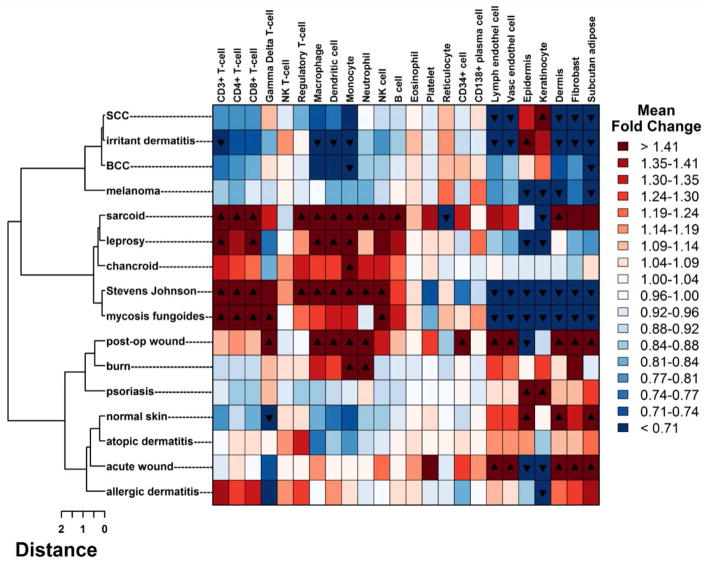
Figure 2. Cell-type specific signature enrichment.
For each of 24 cell-type specific signatures, log fold changes were calculated using average gene expression for each condition. Each fold change represents the enrichment for a particular cell-type in that condition relative to the other 15 conditions. Enrichment profiles for each condition were clustered using Euclidean distance and displayed in a heatmap, where rows correspond to conditions and columns correspond to cell types. Black triangles denote FDR < 0.05 and directionality of fold change.

