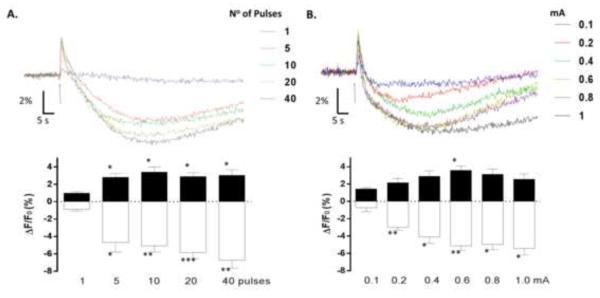
Figure 2. Flavoprotein autofluorescence responses evoked under different stimulation conditions.
A. The upper panel shows representative flavoprotein autofluorescence responses evoked by the indicated number of pulses (pulse duration = 100 μs; pulse frequency=50 Hz; stimulation intensity=600 μA). The lower panel illustrates the average amplitudes of the peak (black bars) and valley (white bars) phases as a function of the number of pulses in the stimulus train (n=7 slices from 5 rats; * p□0.05, ** p□0.01, *** p□0.001 by repeated measures one-way ANOVA followed by Dunnett’s multiple comparison post-hoc test). B. The upper panel shows representative flavoprotein autofluorescence responses evoked by the indicated stimulus intensities. Other stimulation parameters were held constant (10 pulses, pulse duration=100 μs; pulse frequency=50 Hz). The lower panel illustrates the average amplitudes of the peak (black bars) and valley (white bars) phases as a function of the stimulation intensity (n=5 slices from 5 rats; * p?0.05, ** p□0.01 by repeated measures one-way ANOVA followed by Dunnett’s multiple comparison post-hoc test). Data are presented as the mean ΔF/F0 (%)±SEM. The arrows indicate time of stimulation.

