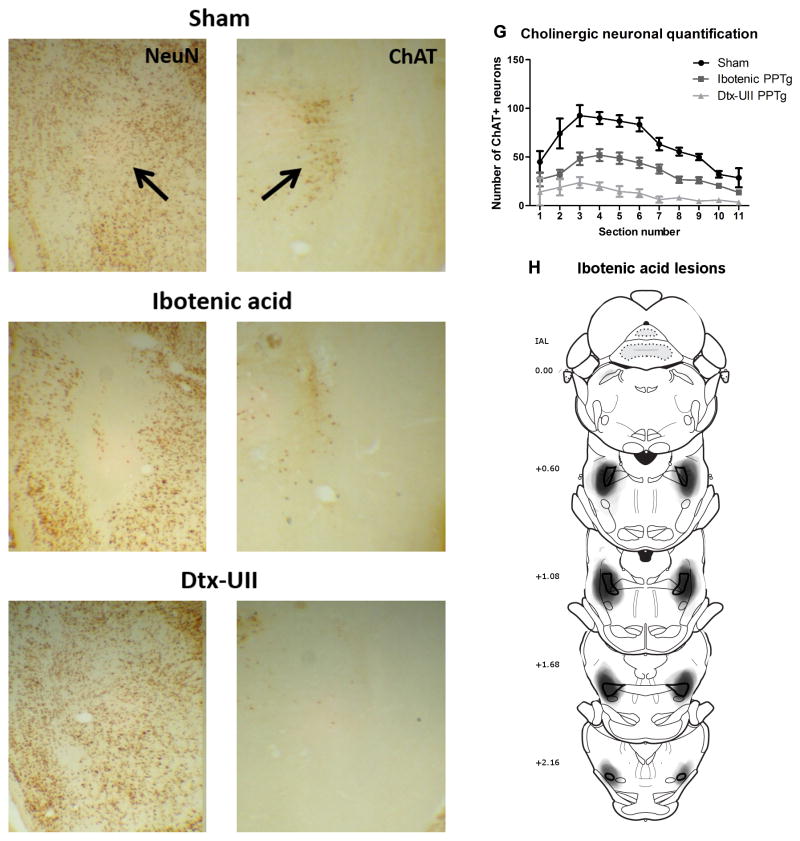
Figure 1.
Histological results. Panels A–F show photographs of sham (A,B), ibotenic acid (C,D,) and Dtx-UII (E,F) lesioned rats, with neuronal nuclei (NeuN) staining on the left (A,C,E) and ChAT staining on the right (B,D,E). The black arrow indicates the location of the PPTg. 1G shows results of quantification of ChAT+ neurons within the PPTg for sham, ibotenic acid and Dtx–UII UII-lesioned rats. 1H shows areas of lesion damage in the ibotenic acid lesion group, drawn from the NeuN staining onto schematics from the atlas of Paxinos and Watson (2005). The PPTg is outlined in black and each individual lesion was drawn as a semi-transparent grey shape corresponding to lesioned area observed on the NeuN section, forming a composite image representing all lesions. Numbers on the left show distance from the interaural line (IAL).

