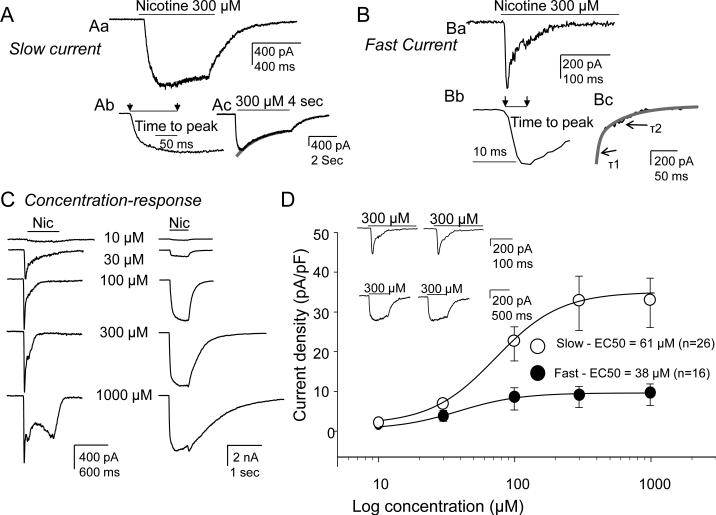
Figure 1. Two types of nicotine-evoked currents observed in DRG neurons from naïve rats and their concentration-response curves.
Currents were evoked with 300 μMnicotine applied for 500 ms. A. Representative trace showing slow current activated (Ab) and inactivated (Ac) slowly. B. Representative trace showing fast current activated (Bb) and inactivated (Bc) rapidly. The activation rate (the time from the start to peak) of the slow current (Ab) was an order of magnitude slower than that of fast current (Bb). The decay of the slow current in response to a 4 sec application of nicotine could be well fitted with a single exponential (Ac) revealing a time constant of decay of 1.83±0.40 s (n=9). The decay of the fast current was well fitted with a double exponential (Bc) revealing time constants of 16.3 ± 1.9 ms (T1) and 61 ± 10.6 ms (T2; n=15). C. DRG neurons were challenged with increasing concentrations of nicotine ranging from 10 to 1000 μM at an inter-stimulus interval of 3 minutes. Typical concentration responses of fast (left traces) and slow current (right traces) are shown. Note that a more slowly activated current emerged at 1mM nicotine in neurons with fast current (bottom left trace). D. Pooled data fitted with a Hill equation to estimate the EC50 indicate that while slow current density was significantly greater than that of the fast current, the peak evoked fast current was achieved at lower concentrations of nicotine than that of slow currents (EC50 was 61 μM for slow current (n=26 cells) vs 38 μM for fast current (n=16 cells). Inset: Repeated application of 300 μM nicotine at 3 min interval did not change the current amplitude of either the slow or fast current.

