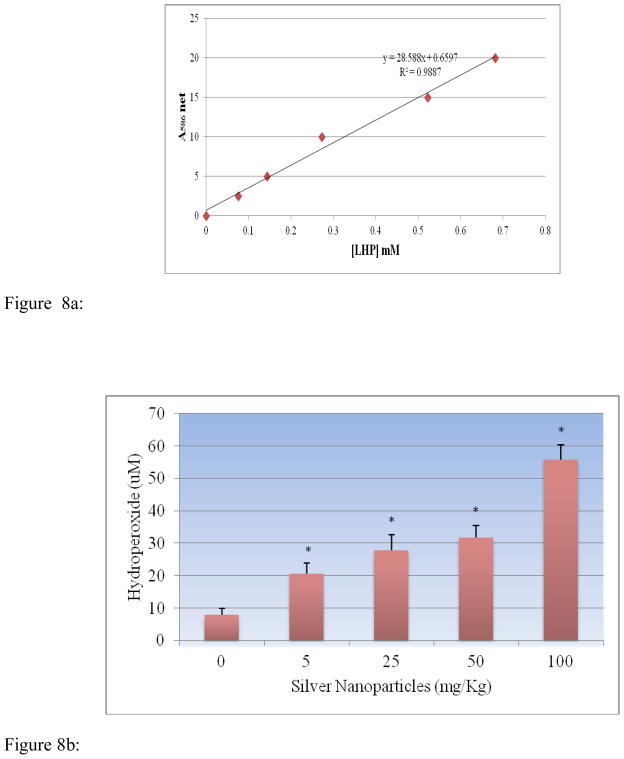
Figure 8.
Figure 8a: Standard curve for Lipid hydro peroxides (LPO) assay where y-axis represents absorbance at 500nm whereas x-axis represents the concentrations of reference standard (nmol).
Figure 8b: Effect of silver nanoparticles on the level of lipid hydroperoxides in liver homogenate of Sprague-Dawley rats. Each experiment was done in triplicate. Data represents mean ± SD. Statistical significance (p<0.05) is depicted as (*).

