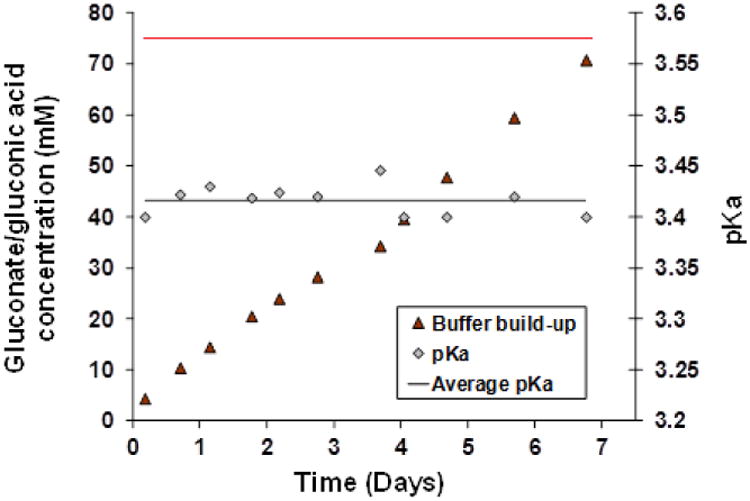
Figure 10.

Estimated buildup of gluconic acid/gluconate buffer ([A]T,0) with time in Cell II of the oscillator prototype. Also shown are the estimated pKa values estimated at each time point. Estimations are based on curves in Fig. 9 fitted to Eq. (1). Average pKa=3.42 (black line). Cell I glucose concentration (75 mM) is shown as a red line.
