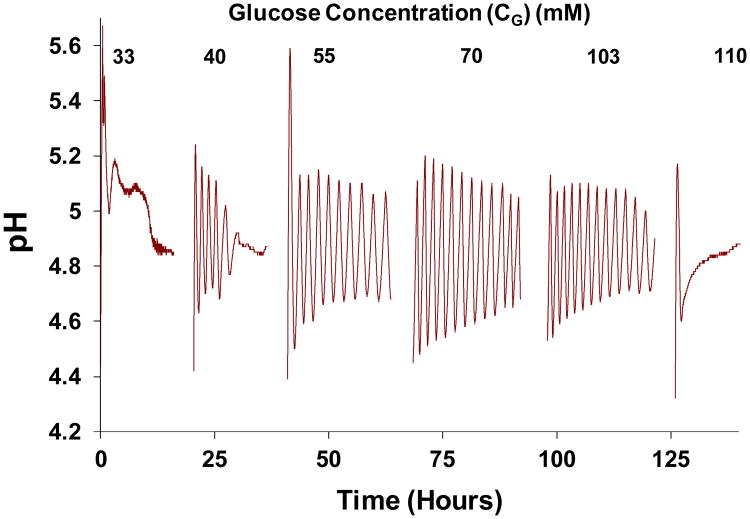
Figure 3.
pH transients observed in Cell II in response to a range of glucose concentrations (CG, mM) introduced into Cell I, with pH in Cell I maintained at 7.0. Hydrogel membrane was synthesized with 10 mol% MAA, and exposed marble surface area was S=10 cm2 so kmarble=1.25×10⁻³ sec-1. Breaks correspond to periods during which solutions in Cells I and II were changed, and membrane reconditioning occurred.

