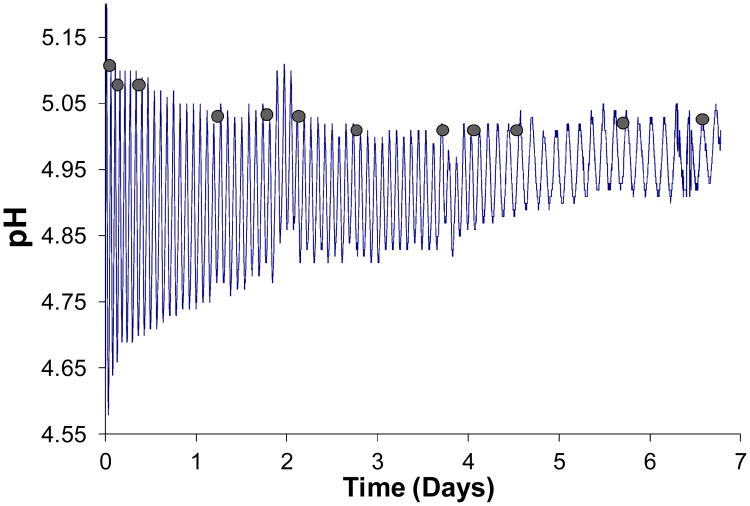
Figure 6.
pH oscillations in Cell II over 6.77 days. The membrane was a 10 mol% MAA-90 mol% NIPAM hydrogel. Marble surface area was S=12cm2. Glucose in Cell I was CG=75 mM. Shaded circles indicate points at which 700 μl aliquots were withdrawn to determine, by titration, the extent of buffer buildup in Cell II as a function of time.

