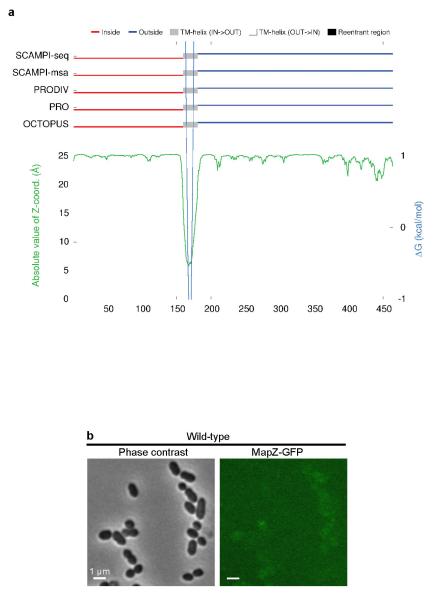
Extended Data Figure 2. Prediction of MapZ topology.
a. MapZ topology (i.e. specification of the membrane spanning segments and their IN/OUT orientation relative to the membrane) was predicted by five different topology algorithms (SCAMPI-seq, SACAMPI-msa, PRODIV-TMHMM, PRO-TMHMM and OCTOPUS) using TOPCONS (http://topcons.net). ZPRED (green line) predicts the distance to the membrane centre of each amino acid and ΔG-scale (light blue) shows the predicted free energy of membrane insertion for a window of 21 amino acids centred around each position in the sequence. The trans-membrane span is indicated in grey. Prediction of cytoplasmic and extracellular localizations are shown in red and dark blue, respectively. b. Wide-field microscopy images of cells producing the C-terminal fusion of MapZ with GFP. GFP fluorescence (right panel) and Phase contrast images (left panel). Images are representative of experiments made in triplicate.

