Figure 1.
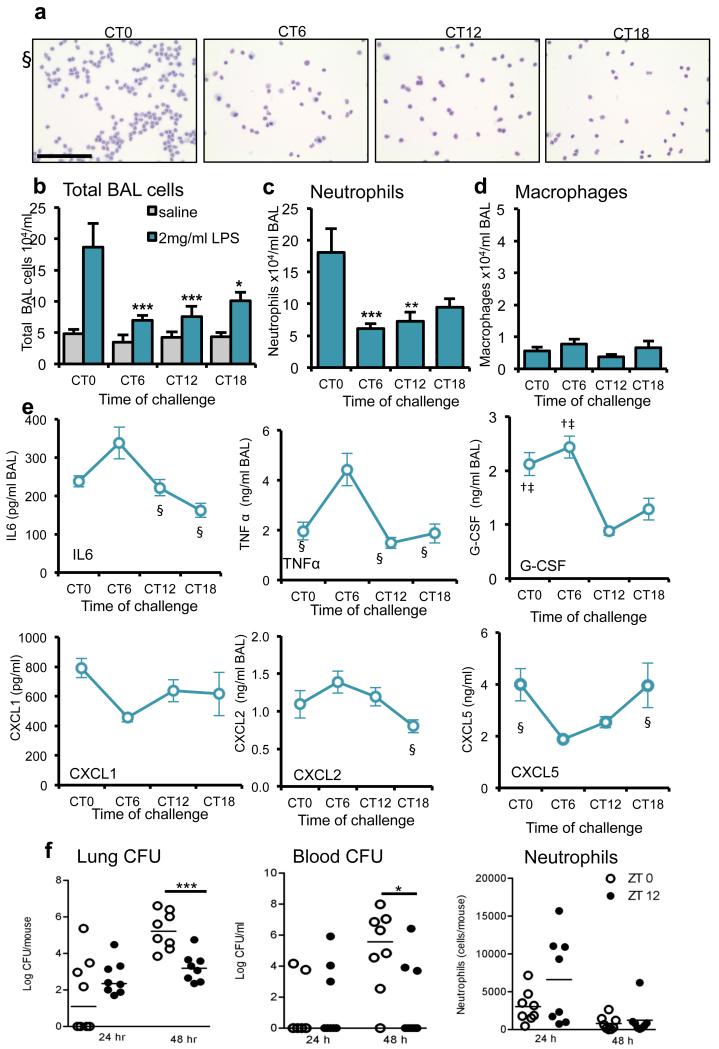
The pulmonary inflammatory response to LPS administration is gated by the circadian clock. (a) Staining of cytospins of BAL fluid from LPS-treated C57Bl/6 mice. Scale bar, 100 μm. (b) Total cell counts in BAL samples collected after LPS challenge at CT0 (n = 6), CT6 (n = 7) CT12 (n = 8) and CT18 (n = 6) or vehicle (n = 4/time point), two-way analysis of variance (ANOVA) and post hoc Bonferroni) (c) Neutrophil and (d) macrophage numbers in the same samples (one-way ANOVA and post hoc Bonferroni) (e) Cytokine levels in these BAL samples were compared between time points using one-way ANOVA and post hoc Bonferroni) § significantly different from CT6 (P≤0.05); † significantly different from CT12 (P≤0.05); ‡ significantly different from CT18 (P≤0.05).; G-CSF, granulocyte colony–stimulating factor. (f) Bacterial load in the lung and blood, and neutrophil counts in BAL, 48h after infection of C57Bl/6 mice with S. pneumoniae (n = 8/time point) at dawn (ZT0) and dusk (ZT12) (median values marked, Mann-Whitney U-test). Data are expressed as mean ± s.e.m and *P ≤ 0.05, **P ≤ 0.01, ***P ≤ 0.005.

