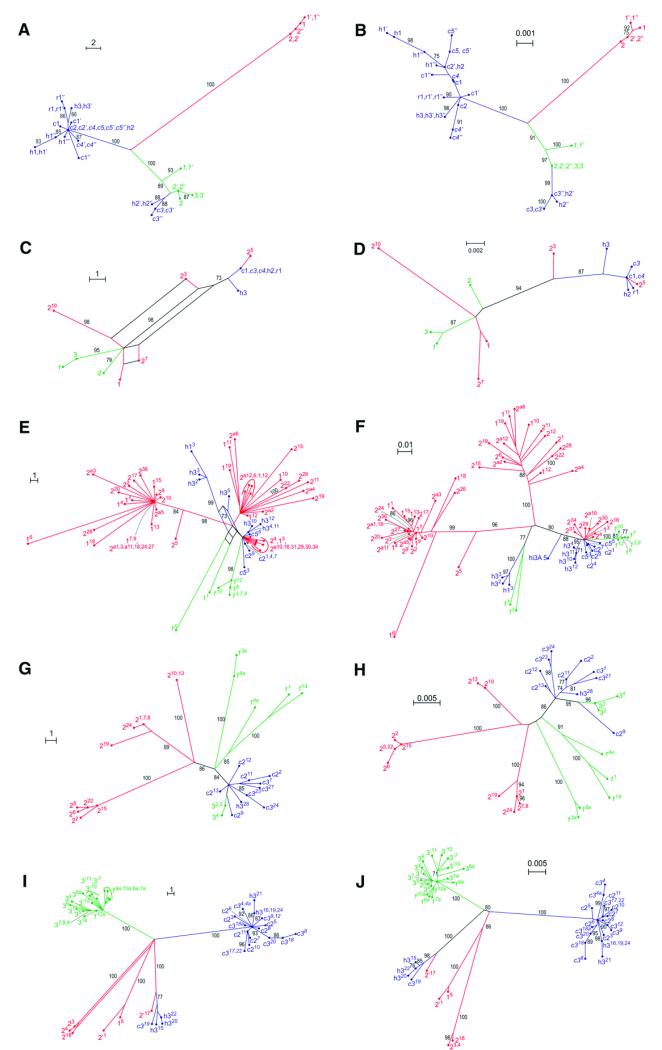
Fig. 3. Genealogical relationships of nuclear and plastid DNA sequences of Melampodium cinereum(blue; the three varieties cinereum, hirtellum, and ramosissimum indicated by their initials), M. leucanthum (green) and M. argophyllum (red) inferred via parsimony splits networks (A, C, E, G, I) and maximum likelihood trees (B, D, F, H, J).
(A, B) Plastid data, (C, D) nuclear ITS, (E, F) 5S rDNA nontranscribed spacer, (G, H) PgiC copy I, (I, J) PgiC copy II. Numbers at splits or branches are bootstrap support values of 70 or higher. Population numbers as in Table 1, different individuals from the same population indicated by apostrophes. In (E-J), different clones are designated with superscript numbers.

