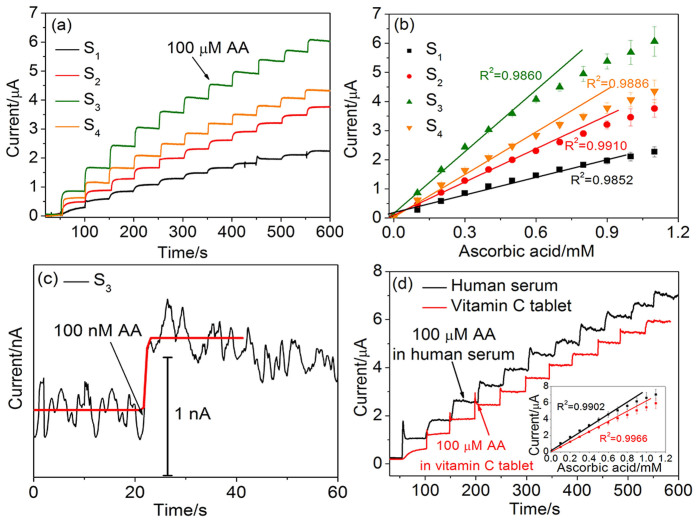
Figure 4.
Amperometric response of (a) S1, S2, S3 and S4 to successive additions of 0.1 mM AA at an applied potential of 0.15 V. (b) The corresponding calibration curves of (a). (c) S3 to the additions of 100 nM AA at an applied potential of +0.15 V. (d) S3 to successive additions of human serum (black trace) and Vitamin C tablet (red trace) contained 100 μM AA. Inset is the corresponding calibration curves of (d).

