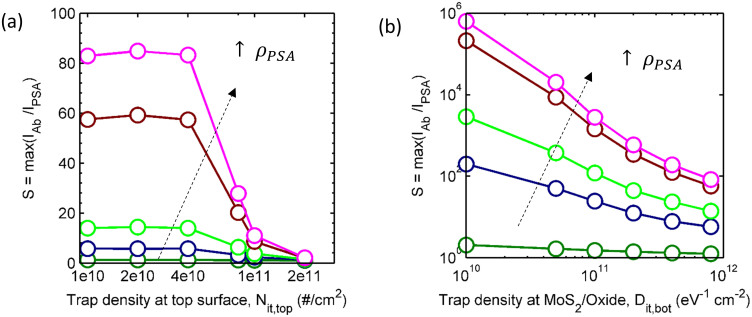
Figure 7. Improving the sensitivity by interface passivation.
(a) Variation of MoS2 sensitivity as a function of interface trap densities at top surface of MoS2 for different PSA concentrations (with Dit,bot = 8 × 10¹¹ eV−1cm−2)) b) Variation of MoS2 sensitivity as a function of interface trap density at MoS2-oxide interface (with Nit,top = 4 × 10¹⁰ eV−1cm−2) for different PSA concentrations: 1 pg/mL (Green), 10 pg/mL (Blue), 100 pg/mL (Lime), 1 ng/mL (Brown), 10 ng/mL (Magenta).

