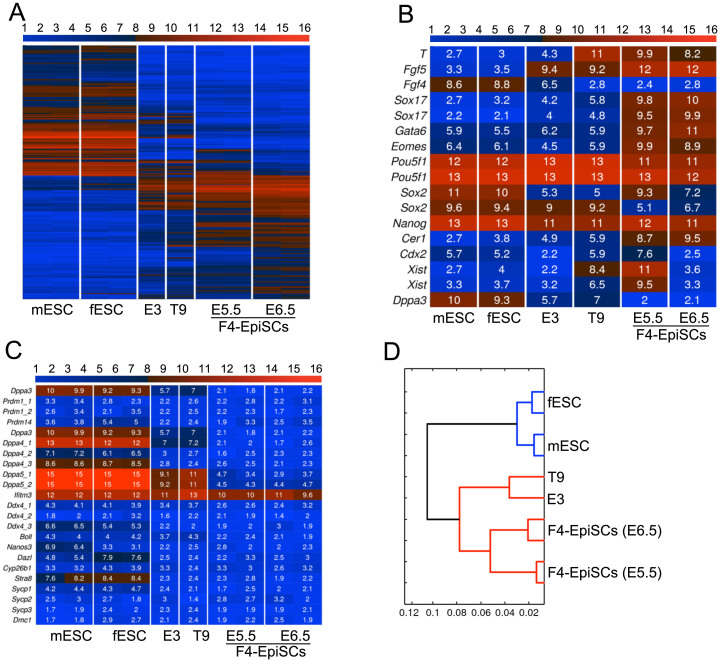
Figure 3. Gene expression profiles of F4-EpiSCs, ESCs, and other EpiSC lines.
(A) Heat map of the global gene expression profiles of ESCs, E3, T9 EpiSC lineS, and F4-EpiSCs. mESC and fESC denote, male ESC and female ESC, respectively. (B) Heat map of pluripotency- and EpiSC-related genes. (C) Heat map of germ cell and meiosis markers. (D) Hierarchical clustering shows that two F4-EpiSC lines clustered close together, but distinct from other EpiSC lines (E3 and T9).

