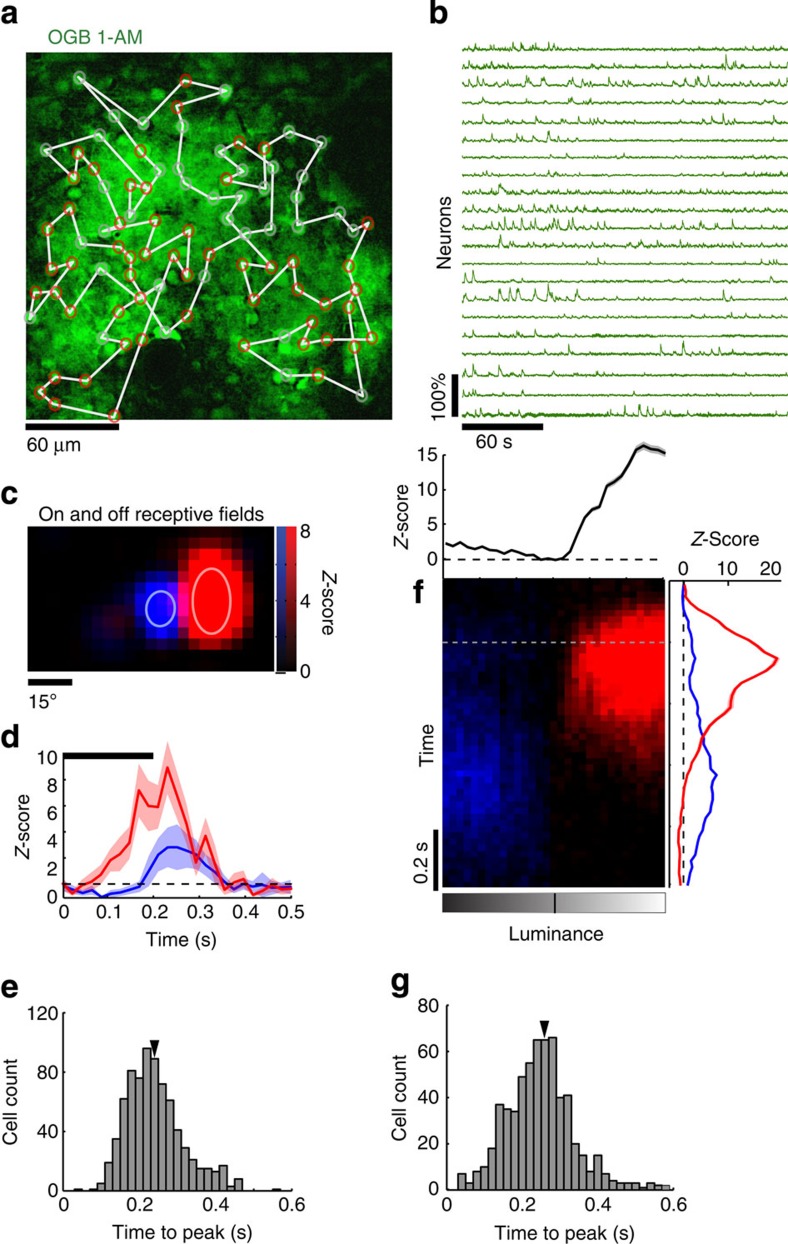
Figure 1. Neuronal spikes, receptive fields and intensity response curves as revealed by calcium imaging.
(a) Baseline image used to identify the location of cells loaded with OGB-1AM. The two-photon laser scan-path is overlaid in white on top of the image. Cells displaying significant visual responses are marked with red circles. (b) Examples of calcium traces of neurons that were imaged through the scan-path. (c) Spatial ON (red) and OFF (blue) receptive fields of an example neuron obtained with calcium imaging in response to sparse noise stimuli. Gaussian fits are represented by ellipses in light colours. (d) Averaged evoked responses to the complete sparse noise sequence for ON (red) and OFF (blue) stimuli. Dashed line indicates the baseline spontaneous activity and the bold black line indicates the duration of stimulus presentation. S.e.m. values are shown as shaded areas. (e) Response time-to-peak distribution for all neurons displaying a significant sensory response (n=761, the arrow indicating the average: 0.24 s). (f) Neuron population responses to full-field flashes of various luminance intensities as a function of time. The curves on the right margin indicate the average response time course for ON (red) or OFF (blue) stimuli. The intensity curve on top is the population Z-score estimated around the dashed grey line (200 ms±100 ms). S.e.m. values are shown as shaded areas. (g) Population distributions over all recorded neurons with significant responses to full-field flashes showing response time-to-peak (n=620, average at 0.27 s).

