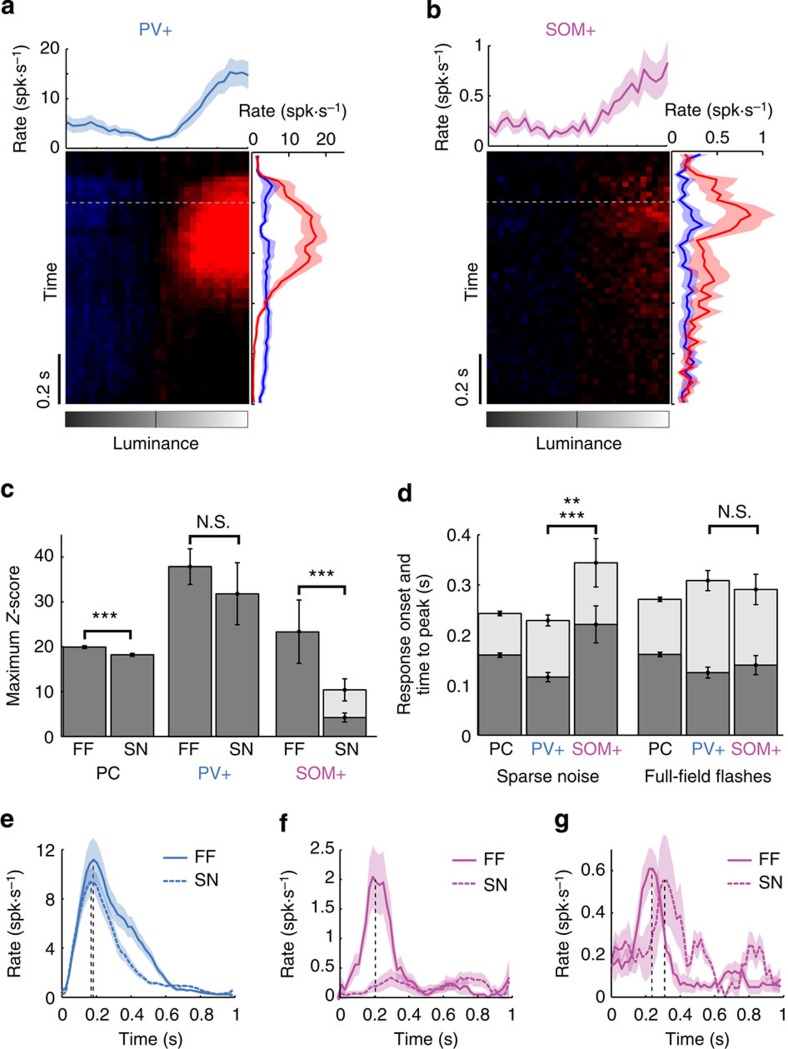
Figure 3. PV+ and SOM+ neuron responses to full-field flashes.
(a) Targeted cell-attached recordings of PV+ neuron (n=20) responses to full-field flashes of various luminance intensities as a function of time. The curves on the right margin indicate the average response time course for ON (red) or OFF (blue) stimuli. The intensity curve on top is the estimated rate averaged around the dashed grey line (200 ms±100 ms). (b) Same as a obtained by targeted cell-attached recordings of SOM+ neurons (n=23). (c) Bar plots comparing the maximum Z-score of pyramidal (PC), PV+ and SOM+ neurons in response to sparse noise (SN) and full-field flashes (FF). PC: n=1,928 for SN and n=1,518 for FF. PV+ neurons: n=22 for SN and n=20 for FF. SOM+ neurons: n=37 for SN and n=23 for FF. For SOM+ neurons, the grey bar indicates the maximum Z-score computed over all SOM+ neurons that displayed significant responses during sparse noise (n=16). ***P<0.001 (two-tailed t-test) comparing responses for all cells during sparse noise and full-field flashes; NS, not significant, P=0.43. (d) Bar plots comparing the response onset (grey bars) and time-to-peak (dark bars) of pyramidal cells (PC), PV+ and SOM+ neurons in response to sparse noise (SN) and full-field flashes (FF). PC: n=761 for SN and n=620 for FF. PV+ neurons: n=22 for SN and n=20 for FF. SOM+ neurons: n=16 for SN and n=21 for FF. **P=0.005 for peak and ***P<0.001 for onset response (two-tailed t-test); NS, not significant, P=0.41 for peak and P=0.4 for onset response. (e) Averaged evoked PSTHs in response to sparse noise (dashed line) or full-field (continuous line) for a PV+ neuron. Response time-to-peak for each curve is indicated with a vertical dashed line. (f) Averaged evoked PSTHs in response to sparse noise (dashed line) or full-field (continuous line) for a SOM+ neuron that displayed a change in Z-score amplitude. (g) Same as f for a SOM+ neuron that displayed a change in response onset. Error bars and shaded areas indicate s.e.m. throughout the figure.

