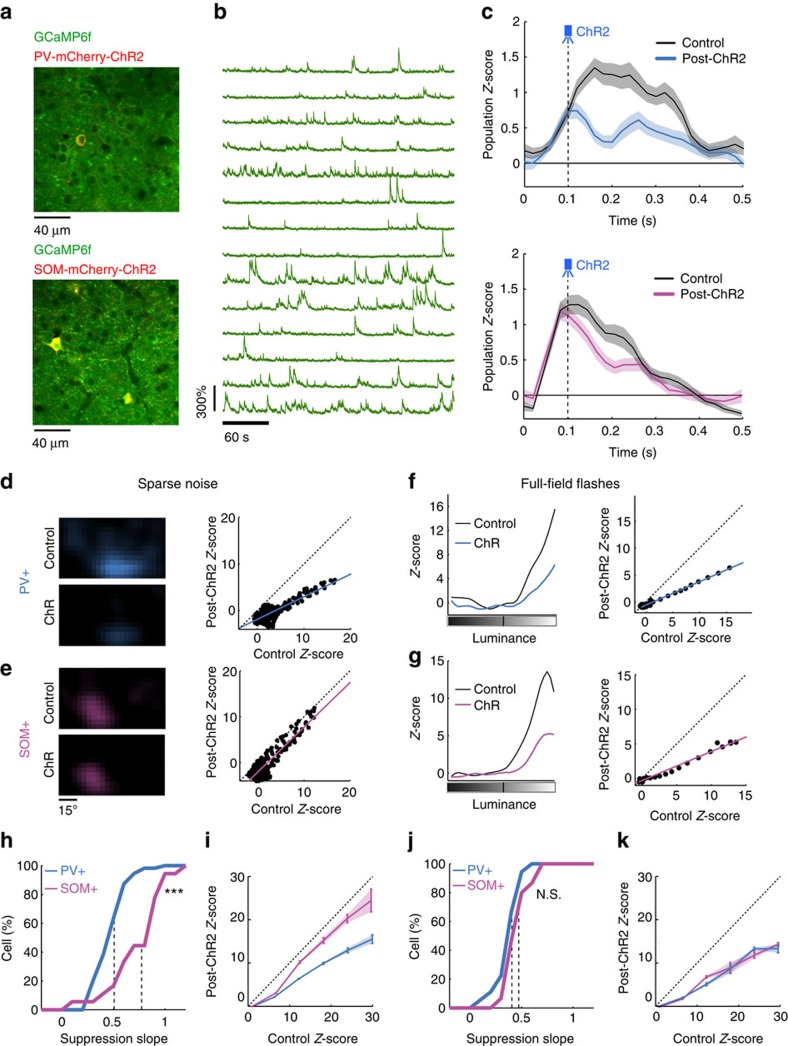
Figure 6. Effect of ChR2-mediated PV+ and SOM+ neuron activation on target cells of awake head-fixed mice.
(a) Image of a region of V1 expressing GCaMP6f in all neurons and mCherry-ChR2 in PV+ (top) or SOM+ (bottom) neurons. (b) Example calcium traces normalized to baseline (df/f) obtained during presentation of sparse noise. (c) Population responses in control condition (black) and when a blue light pulse was delivered to PV+ (blue, n=30) or SOM+ (pink, n=26). In awake mice the responses were faster than in the anaesthetized case and we therefore used pulses at 0.1 s instead of 0.2 s. S.e.m. values are shown as shaded areas. (d) Left: example receptive fields of a neuron imaged during control condition (top) and during PV+ activation (bottom). Right: point-by-point comparison between responses at corresponding receptive field locations. The blue line indicates the linear fit (slope=0.47, r=0.93, P<0.001, paired t-test). (e) Same as d but during ChR2-stimulation of SOM+ neurons. Slope=0.93, r=0.88, P<0.001, paired t-test. (f) Left: example luminance-response curves of a neuron imaged in the control condition (black) and during PV+ (blue) neuron stimulation. Right: point-by-point response comparison for each luminance. The blue line indicates the linear fit (slope=0.44, r=1, P<0.001, paired t-test). (g) Same as f but during SOM+ neuron activation. Slope=0.42, r=0.99, P<0.001, paired t-test. (h) Cumulative distributions of the linear fit slope for all cells that displayed a significant suppression (P<0.01, Wilcoxon signed-rank test) in response to PV+ (blue) or SOM+ (pink) activation during sparse noise presentation (n=55 for PV+ and n=18 for SOM+, P<0.001, unpaired t-test). (i) Comparison of the population Z-score averaged over all neurons, between the control condition and when PV+ (n=55, slope=0.56) or SOM+ (n=18, slope=0.89) neurons were stimulated during sparse noise. (j–k) Same as h–i but during full field-flashes. (j) n=18 for PV+ and n=15 for SOM+, P=0.11. (k) PV+ (n=18, slope=0.51) and SOM+ (n=15, slope=0.50). One-way ANOVA revealed a significant difference between the four groups in h and j (P<0.001 with Bonferroni correction for multiple comparisons). Using post-hoc pairwise t-tests, we found that only SOM+ activation in the SN condition was significantly different.

