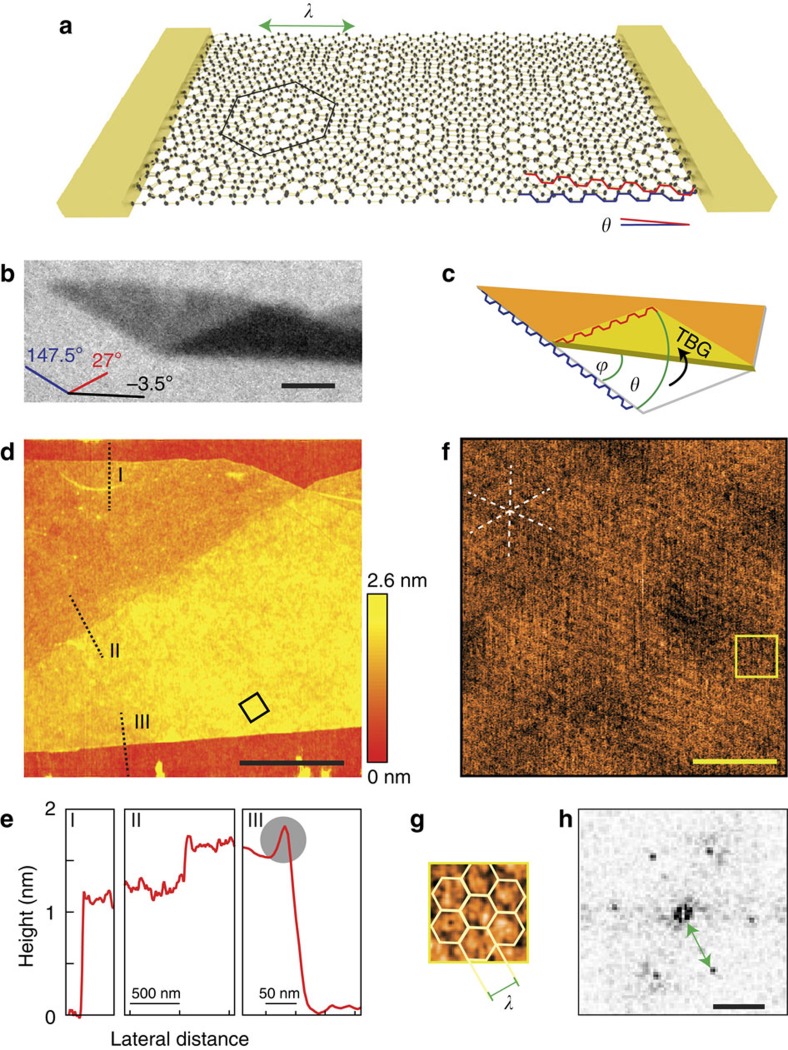
Figure 1. Twisted bilayer graphene in folded samples.
(a) Sketch of a contacted twisted bilayer graphene sample with a rotational mismatch θ between lattices, indicated by the red and blue armchair edges of the two layers. A hexagonal moiré pattern with angle-dependent wavelength λ emerges. (b) Optical image of a folded single layer of graphene. Coloured lines indicate the orientation of the different edges. Scale bar, 2 μm. (c) From the orientation of the original edges and the folding edge, the rotational mismatch can be estimated. Crystallographic edges (interchangeable) and the folding angle ϕ as well as the resulting twist angle θ are highlighted. Note that θ may be projected to θ ε [0°, 30°]. (d) AFM topography map of the folded sample shown in the optical picture. The dotted lines indicate the position and direction of the cross-sections depicted in e, the black box approximately marks the area of the friction AFM scan in f. Red colour corresponds to low, yellow to high topographic features, as indicated by the colour scale bar. The black lateral scale bar indicates 1 μm. (e) Averaged cross-sections over a small area AFM topography scan at intersections of substrate to monolayer graphene (I), monolayer to twisted bilayer (II) and twisted bilayer to substrate (III). In (III) an additional elevation because of the folding can be seen close to the edge (grey circle). (f) Friction AFM image of the TBG. Bottom right corner of the panel corresponds to the bottom corner of the black square in d. The dashed white star indicates symmetry directions of the superlattice, the yellow box approximately marks the area of a close up in g. Scale bar, 50 nm. (g) Close up of the yellow square in f with overlain moiré unit cells. (h) Fourier transform of the lattice in f showing hexagonally arranged peaks corresponding to a trigonal lattice with a 9 nm wavelength. Scale bar, 100 μm−1.

