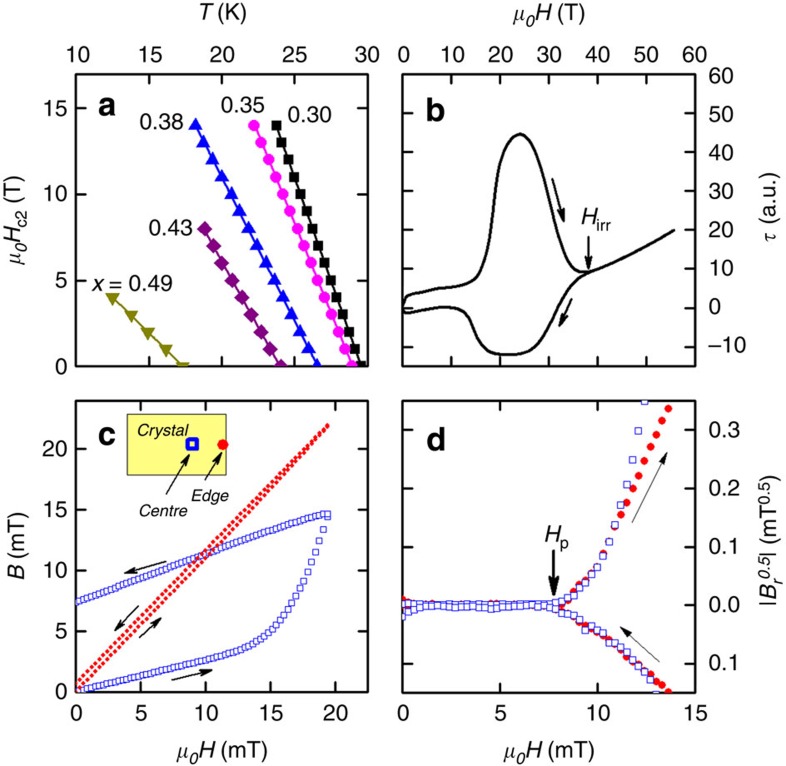
Figure 1. Determination of critical fields.
(a) Hc2(T) data close to Tc(H=0) from heat capacity measurements for different samples of BaFe2(As1−xPx)2. (b) Magnetic torque versus rising and falling field for a sample with x=0.40 at T=1.5 K. The irreversibility field Hirr is marked. (c) Magnetic flux density B versus applied field H as measured by the micro-Hall sensors, for x=0.35 and T=18 K at two different sensor positions: one at the edge of the sample and the other close to the centre (schematic inset). (d) Remnant field Br after subtraction of the linear term due to flux leakage around the sample. |Br|0.5 versus μ0H is plotted as this best linearizes Br(H)14. Note that the changes in linearity of B(H) evident in d are not visible by eye in c.

