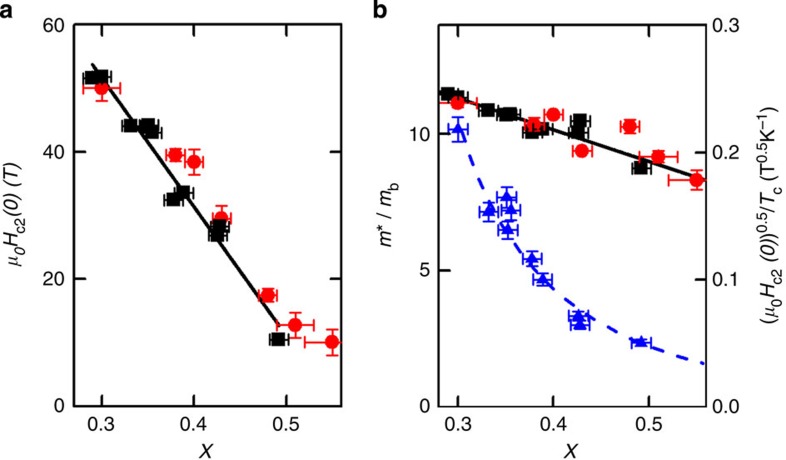
Figure 2. Upper critical field as a function of concentration x.
(a) Hc2(0) in BaFe2(As1−xPx)2 estimated from the slope of Hc2(T) close to Tc using  (squares) 13, and also estimates of Hc2(0) from the irreversibility field at low temperature (T=1.5 K) measured by torque magnetometry (circles). Error bars on Hc2 (circles) represent the uncertainties in locating Hirr and (squares) in extrapolating the values close to Tc to T=0. Error bars on x represent s.d. (b) The same data plotted as (Hc2(0))0.5/Tc, which, in conventional theory, are proportional to the mass enhancement m*. The mass renormalization m*/mb derived from specific heat measurements is shown for comparison (triangles) 10. The dashed line is a guide to the eye and solid lines in both parts are linear fits to the data.

