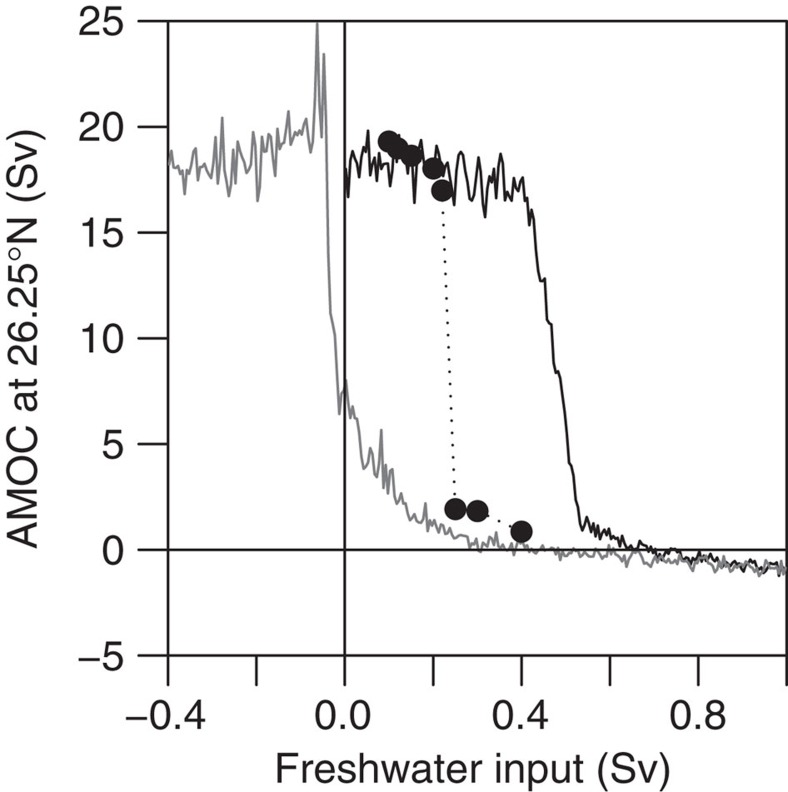
Figure 3. Hysteresis of AMOC in the FAMOUS model.
AMOC transport (Sv) at 26.25°N and ~1,000 m depth is plotted as a function of imposed freshwater input. The solid black line shows the decadal mean AMOC during a transient experiment with freshwater input increasing from 0–1 Sv over 2,000 years. The solid grey line shows the same for freshwater input decreasing from 1 to −0.4 Sv at the same rate. The filled circles show the equilibrium AMOC transport reached during a series of constant-forcing simulations that are initialized from the corresponding point of the transient (increasing forcing) simulation. Adapted from Fig. 2 of ref. 11.

