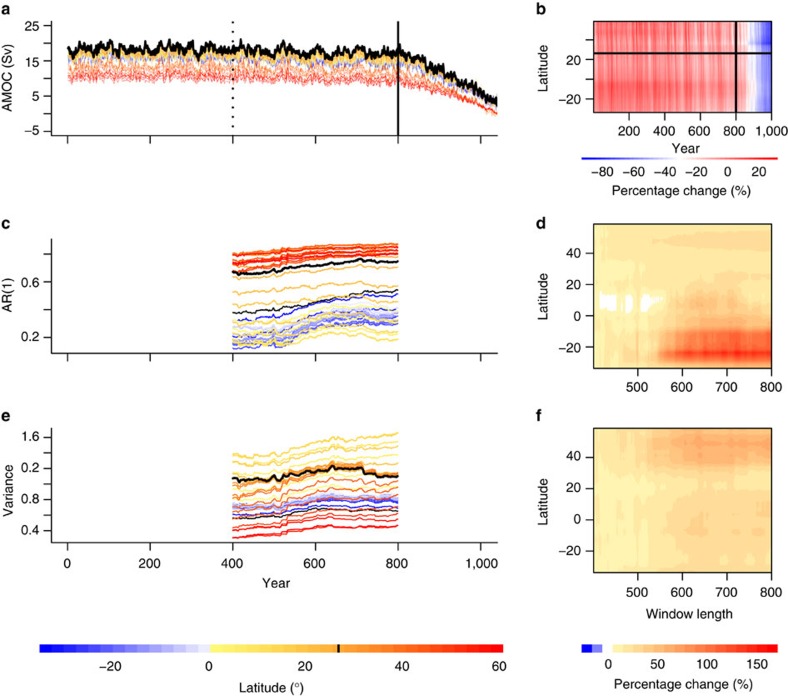
Figure 5. AMOC collapse and candidate early warning signals at each latitude.
(a) Annual time series of AMOC (Sv) at each latitude are cut before collapse begins at 800 years (solid vertical line). (b) Time series are also shown as a contour plot in the time-latitude plane. They are then detrended and the analysis carried out on the residuals (see Methods, example in Fig. 4). A sliding window length of 400 years is used (dotted vertical line in (a) marks the end of the first window) to estimate candidate early warning signals (see Methods): (c,d) AR(1) coefficient, and (e,f) variance. Time series are coloured according to their latitude and 26.25°N (as in Fig. 4) is shown in black and contour plots of the percentage change are also shown.

