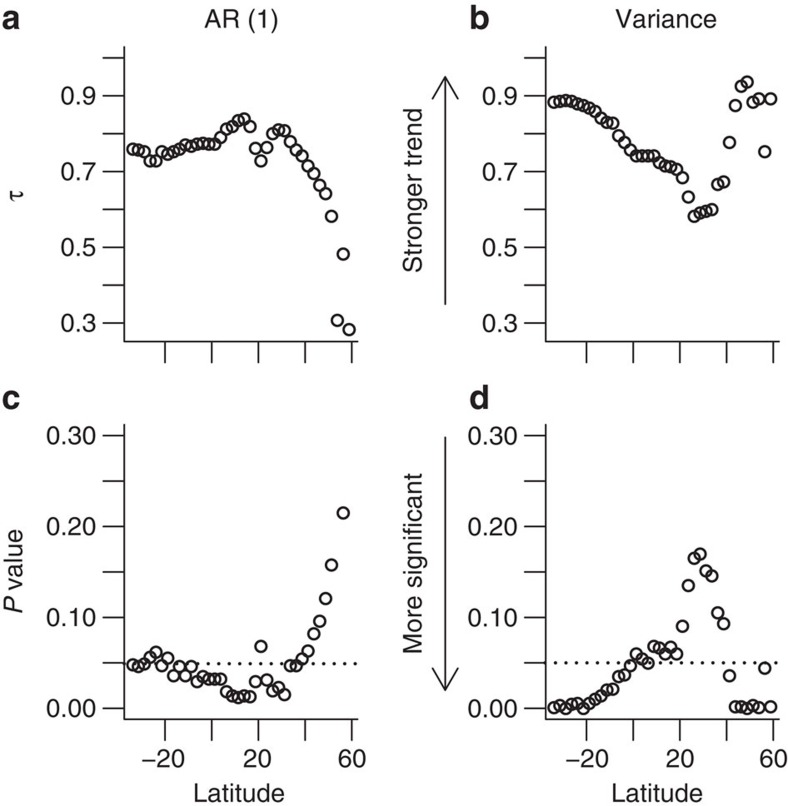
Figure 7. Tendency and significance of indicators for decadal resolution time series.
As in Fig.6, Kendall’s τ values are calculated to determine the tendency of estimated (a) AR(1) coefficient and (b) variance indicators (see main text and Methods). Significance of results, using bootstrapped null model ensembles to determine P values (see main text and Methods), are plotted for (c) AR(1) and (d) variance. Any P values below the dotted horizontal line are significant at the 95% level (P<0.05).

