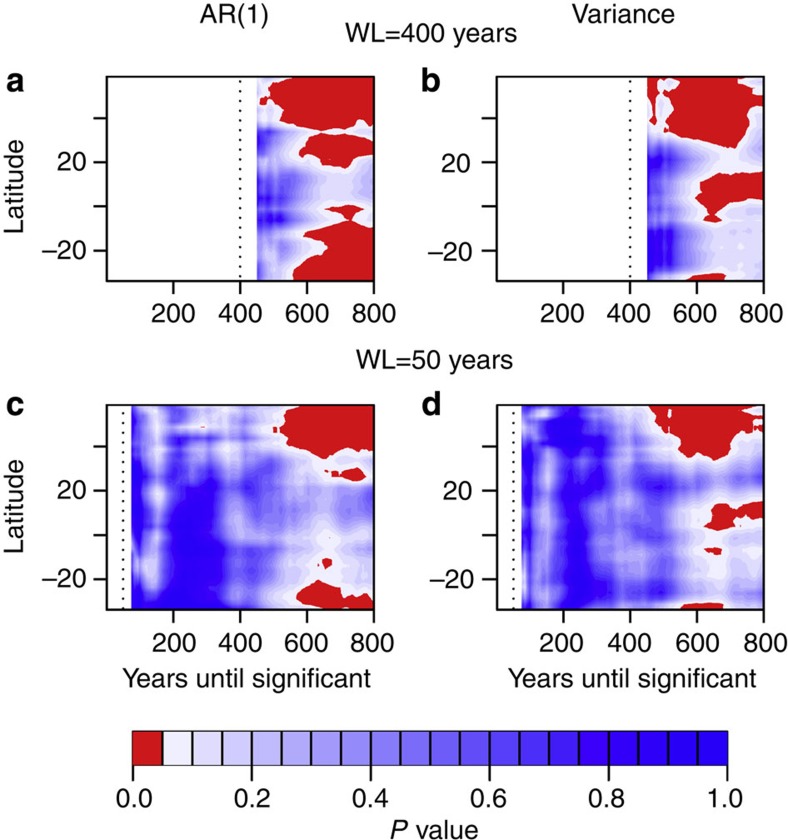
Figure 9. Time to significance of early warning indicators.
Contour plots of significance as a function of latitude and the length of time series used are calculated as described in main text and Methods for window lengths of (a,b) 400 years and (c,d) 50 years (both shown by dotted line), using the annual resolution time series. Significance for each window length is tested after 50 and 25 years, respectively, to allow the indicators to be long enough to test significance on. Areas not shaded are where significance is not calculated due to either the length of time series at that point being less than the window length used (to the left of the dotted line), or the length of the indicator time series is less than 50 or 25 years depending on the window length used. Red shading suggests results are significant at 95% confidence (P<0.05) with blue shading not significant at this level.

