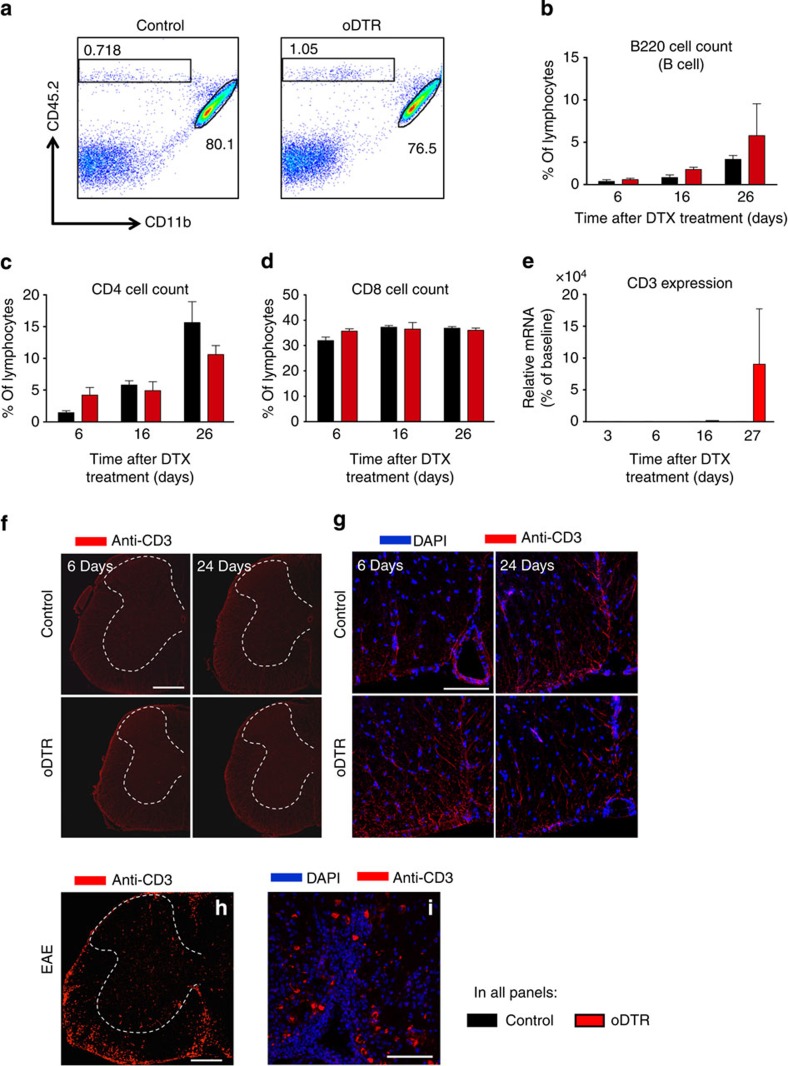
Figure 7. Analysis of lymphocyte infiltration in the CNS of mice with inducible oligodendrocyte ablation (oDTR) and corresponding control littermates after administration of diphtheria toxin (DTX).
(a) Representative plots of cells isolated from the spinal cord of DTX-treated mice 6 days post DTX injection. Percentages of invading cells (CD45hi, CD11b-) and microglia (CD45int, CD11bhi) are shown. (b) Flow cytometric analysis of cells isolated from the spinal cord of DTX-treated mice indicates no change in percentage of B-cell infiltration in oDTR mice as compared with control mice. (c,d) Flow cytometric analysis demonstrating no change in percentage of T cells in the spinal cord of oDTR mice as compared with corresponding control mice after DTX administration. (e) Quantitative RT–PCR expression analysis on CD3 mRNA performed on lumbar spinal cords of DTX-treated control mice and oDTR mice. (f,g) Immunofluorescence analyses showing lack of difference in the abundance of CD3-expressing T cells in spinal cords of DTX-treated control mice and oDTR mice. Images in g represent high-magnificantion view of the white matter. (h,i) Infiltration of CD3-expressing T cells in spinal cords of mice with experimental autoimmune encephalomyelitis (EAE) is shown as a positive control for validation of the anti-CD3 staining. Images in i represent high-magnification view of the the white matter. In b–e, data were analysed via analysis of variance followed by post-hoc Fisher’s test; n=3 or 4 mice per group; *P<0.05. Scale bars represent 300 μm in f and h, and 100 μm in g and i.

