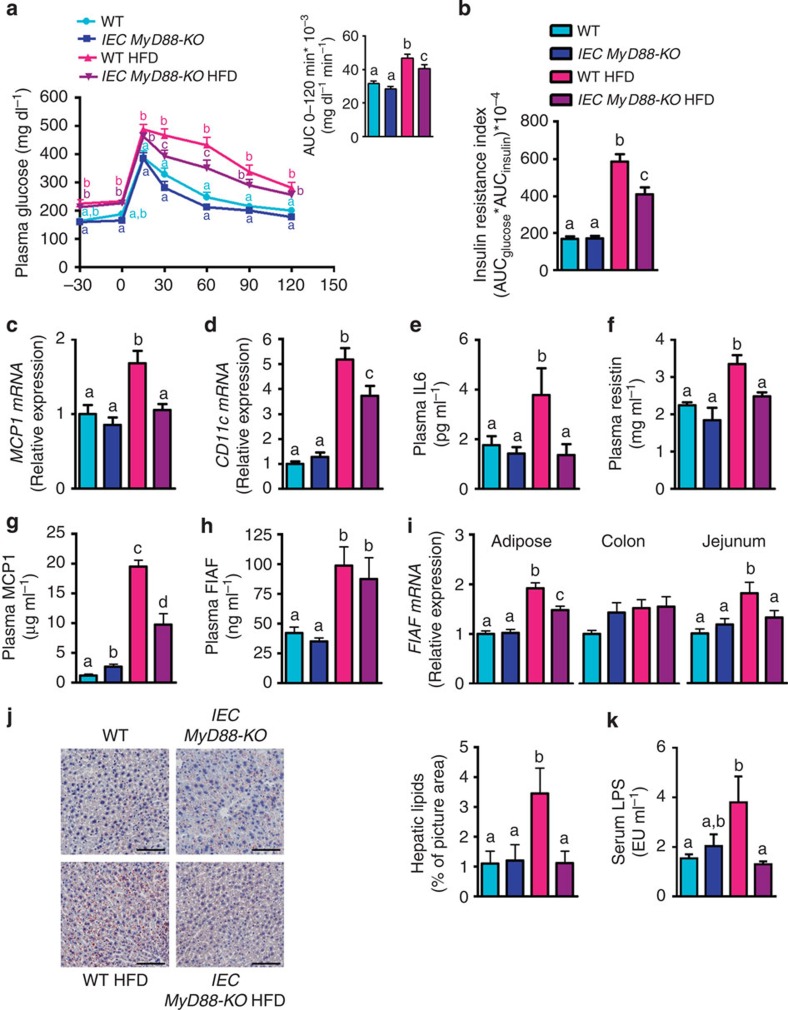
Figure 4. IEC MyD88 deletion improves metabolic disorders associated with obesity.
(a) Oral glucose tolerance test. Inset: area under the curve (AUC) during oral glucose tolerance test (n=10). (b) Insulin resistance index (AUC blood glucose × AUC insulin) (n=10). (c,d) MCP1 mRNA and CD11c mRNA in the adipose tissue (n=25). (e) Circulating IL6 and (f) Resistin, (g) MCP1 and (h) FIAF plasma levels (n=10). (i) FIAF mRNA in the adipose tissue, the colon and the jejunum (n=25). (j) Liver oil red O staining, scale bar, 100 μm. (k) Serum LPS levels measured in the portal vein (EU ml−1) (n=6). Data from c to d correspond to the results of three independent experiments. The data (a,b and e–k) correspond to the results of one experiment. All the replicates represent biological replicates. Data are shown as the means±s.e.m. Data with different superscript letters are significantly different (P<0.05) according to the one-way analysis of variance statistical analysis followed by Newman–Keuls post hoc tests after normalization by log transformation (a–k) or two-way statistical analysis followed by Bonferroni post hoc tests (a).

