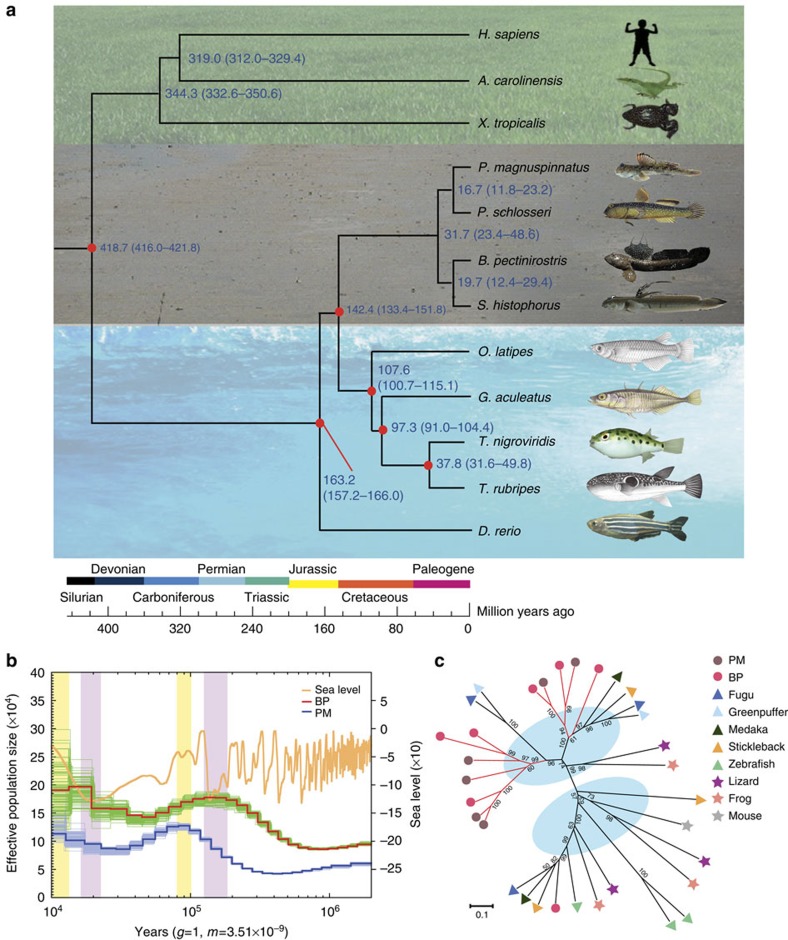
Figure 2. The phylogenetic placement, demographic history and specific TLR13 expansion of mudskippers.
(a) A phylogenetic tree was constructed using fourfold degenerate sites of 1,913 genes from 12 vertebrate species. Blue numbers at the nodes represent divergence time between lineages. Red dots indicate the reference divergence times from the TimeTree (http://www.timetree.org/). (b) The population history of two representative mudskippers (BP and PM) was estimated. The red and blue lines represent the population size changes in BP and PM, respectively. The green and light blue lines, around the red and blue lines, are the PSMC estimates on 100 sequences randomly re-sampled from the original sequences. The orange line denotes the fluctuation of the global sea level. (c) Phylogeny of TLR13 family in ten representative vertebrates showing the expansion of TLR13 in mudskippers.

