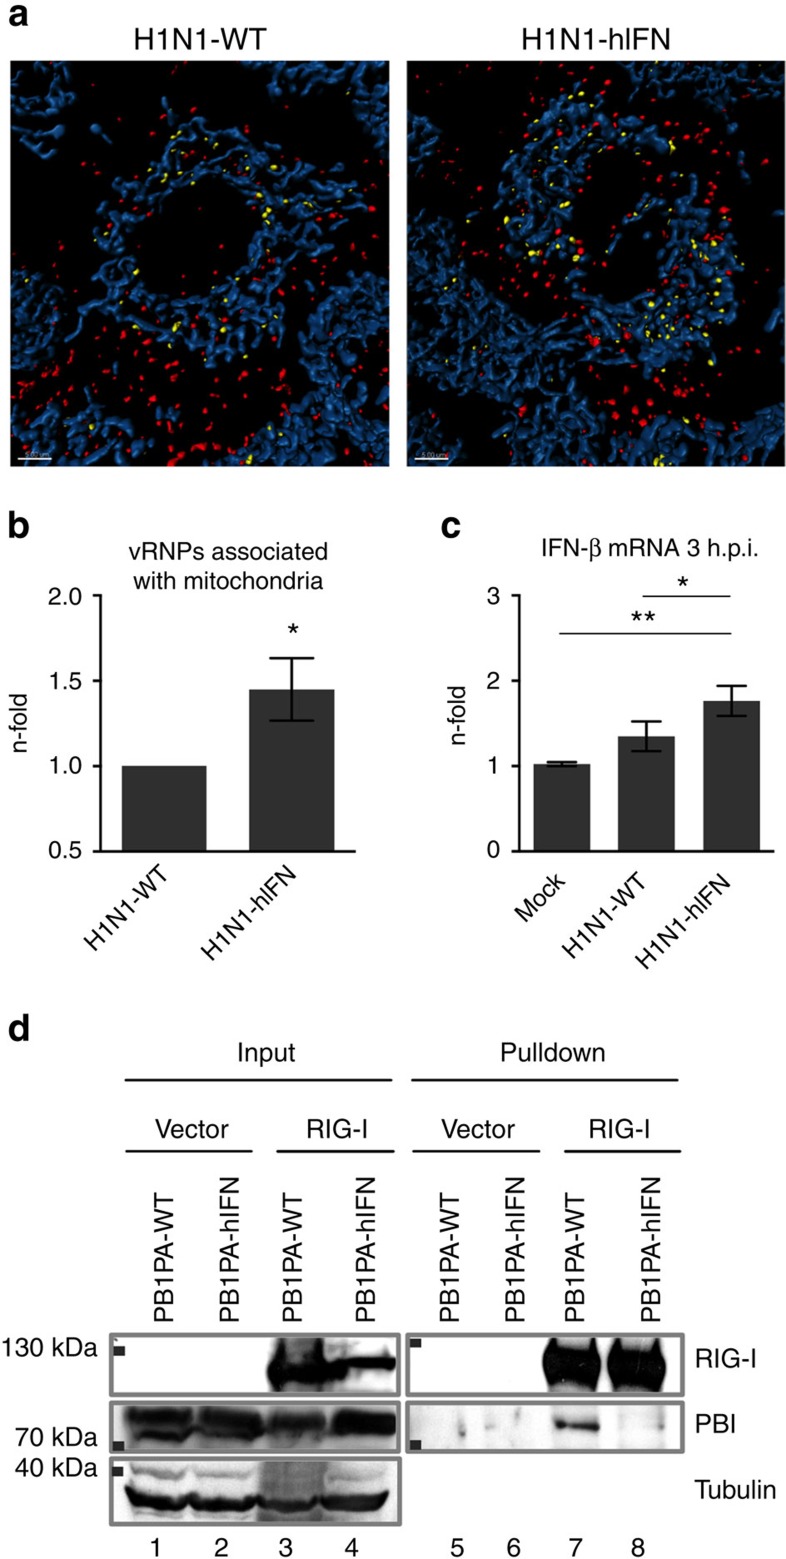
Figure 3. Disruption of the ESIE-motif results in enhanced recruitment of incoming vRNPs to mitochondria.
(a) A549 cells were infected with the indicated viruses (multiplicity of infection (MOI)=50) and prepared for immunofluorescence analysis 3 h.p.i. Distance of vRNPs (<0.5 μm yellow, >0.5 μm red: NP-AF568) to mitochondria (blue: TOM20-AF647) was determined using spinning disk laser scanning confocal microscopy in at least 40 cells per group. Scale bars represent 5 μm. Shown are representative images from three independent experiments; quantification is presented in b. (b) Numbers of vRNPs associated to mitochondria (<0.5 μm) were normalized to the total number of vRNPs detected. Percentages of H1N1-hIFN vRNPs are depicted in relation to H1N1-WT vRNPs (n-fold). (c) A549 cells were infected with the indicated viruses (MOI=5) and prepared for qRT–PCR-analysis. Elevated mRNA levels of IFNβ were measured following disruption of the ESIE-motif 3 h.p.i.; bars show mean±s.d. of three independent experiments. (d) A549 cells were co-transfected with pcAGGS-RIG-I-FLAG or empty vector and pcDNA3-H1N1-PB1-WT/ pcDNA3-H1N1-PA-WT or pcDNA3-H1N1-PB1-hIFN/pcDNA3-H1N1-PA-hIFN and prepared for immunoprecipitation. Complex formation of RIG-I and PB1/PA according to a functional ESIE-motif was analysed by co-immunoprecipitation followed by probing for RIG-I and PB1 (the original blot is shown in Supplementary Fig. 4g). Shown are representative results from three independent experiments. For statistically analysis, (b) Student’s t-test and (c) analysis of variance with Tukey’s test for multiple comparisons were performed *P<0.05, **P<0.01.

